My Role
From confusion to clarity with AI-driven insights
Core is a platform used by AMCs to manage appraisal workflows. To understand their performance, users had to dig through long, detailed pages across the website to piece together bits of information, which they weren't equipped to analyze.
I designed an AI Performance Analytics dashboard embedded within an existing AMC platform called Core by Valuelink, giving AMCs real-time visibility into their financial and operational health. I built it across three analytical lenses with three separate dashboards: Revenue, Turn Time, and Revision. This case study will focus on Revenue only.
Business goals
- Grow revenue by 30%.
- Enable measurable weekly active usage.
Research
Turning user pain points into validated product metrics
I led stakeholder meetings and workshops with our users to identify user pain points, define the most meaningful metrics, and prioritize what users want to see. These points surfaced:
User behavior
- Jumped between dashboards
- Rarely explored trends beyond top-level stats
- Took notes manually
User pain points
- Data was overwhelming and hard to interpret
- Insights weren't actionable. Users did not know what to do next
- Users lacked the confidence to make data-driven decisions
AMC Organizational Chart
User Pain Points and Motivations
Competitors
Competitive analysis
Understanding competitor capabilities helped identify gaps in advanced performance intelligence and actionable analytics across the appraisal lifecycle.
Reggora
Insights primarily center around process performance rather than deeper benchmarking or predictive business intelligence.
ValuTrac
Analytics are largely operational and rule-based rather than delivering strategic, cross-workflow performance insights.
Anow
Analytics focus mainly on workflow visibility and productivity monitoring rather than holistic performance benchmarking or root-cause driven insights.
Launch
Advocating for an iterative launch
I disagreed with my PM on launching the entire feature set (Revenue, Turn time, Revision) at once. I advocated for an incremental rollout instead, prioritizing validation, faster feedback loops, and continuous improvement.
We settled on releasing the Revenue dashboard first, monitoring for feedback before expanding further. The incremental approach proved its value early, surfacing issues that shaped the design decisions covered below.
Design
Rejected designs
These are the designs I explored and rejected.
The final design flow
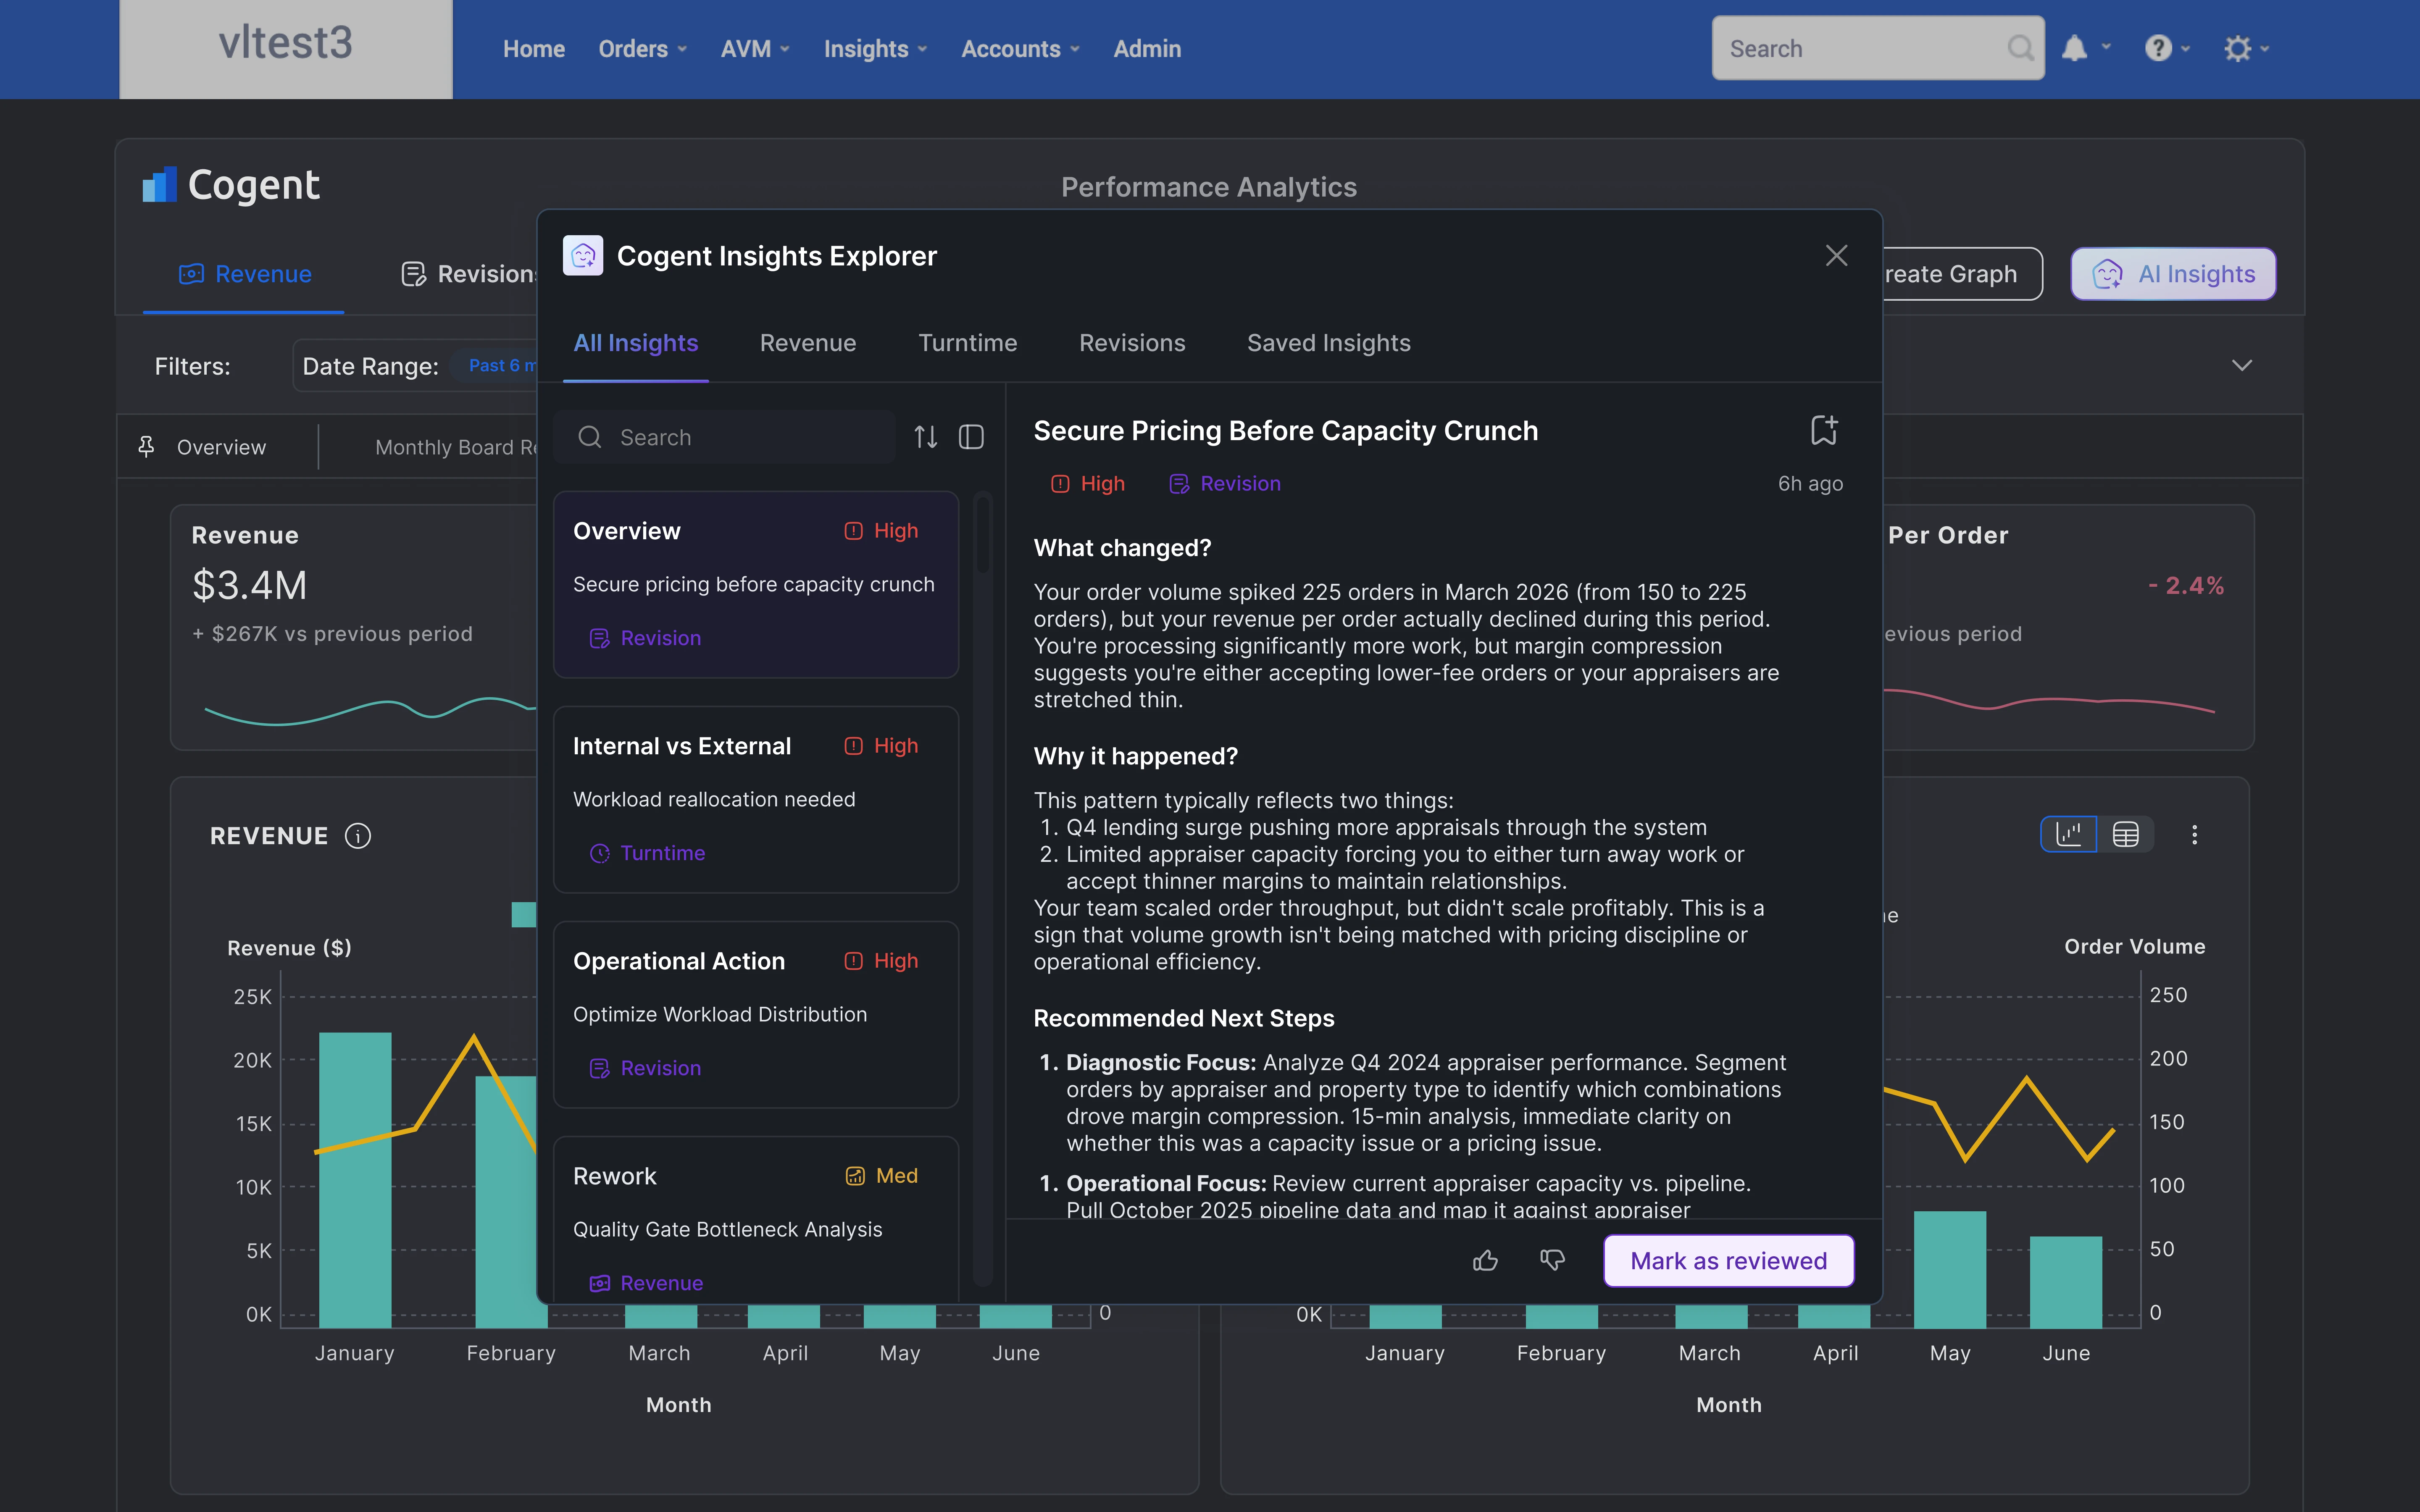
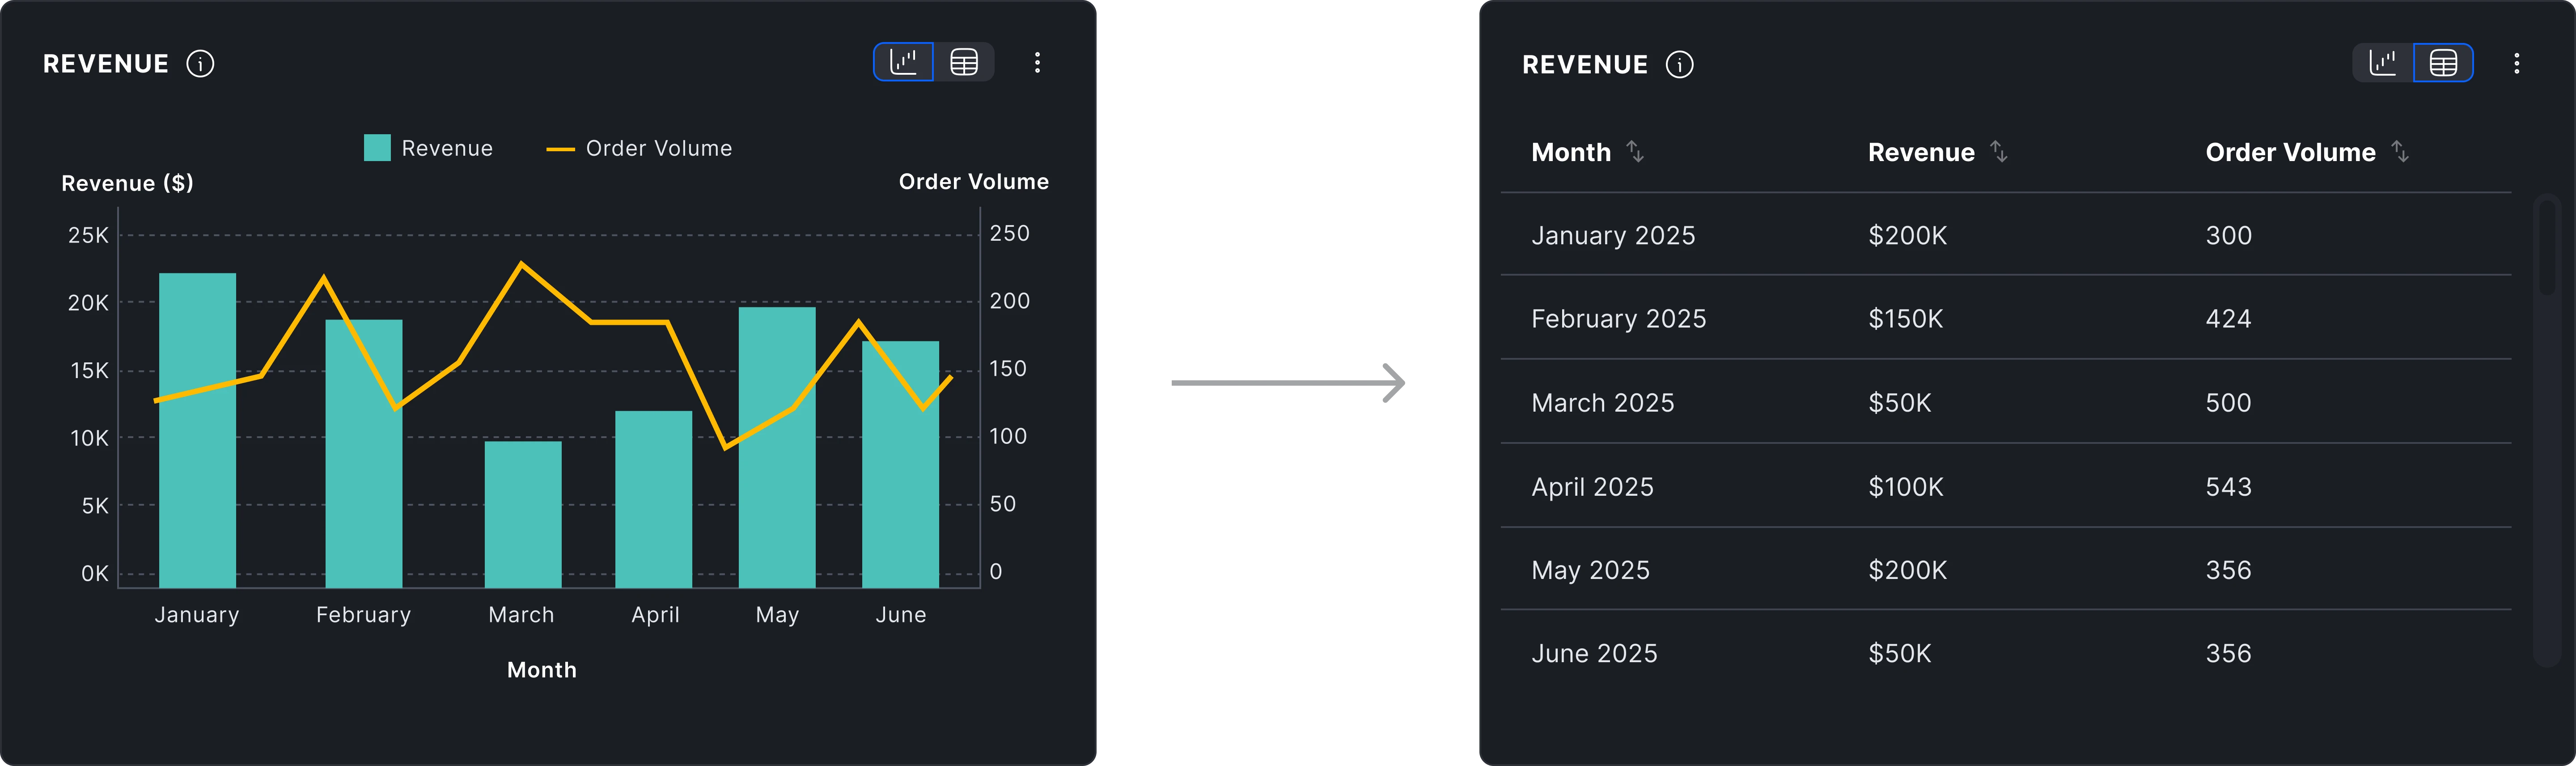
Cogent AI Performance Dashboard.
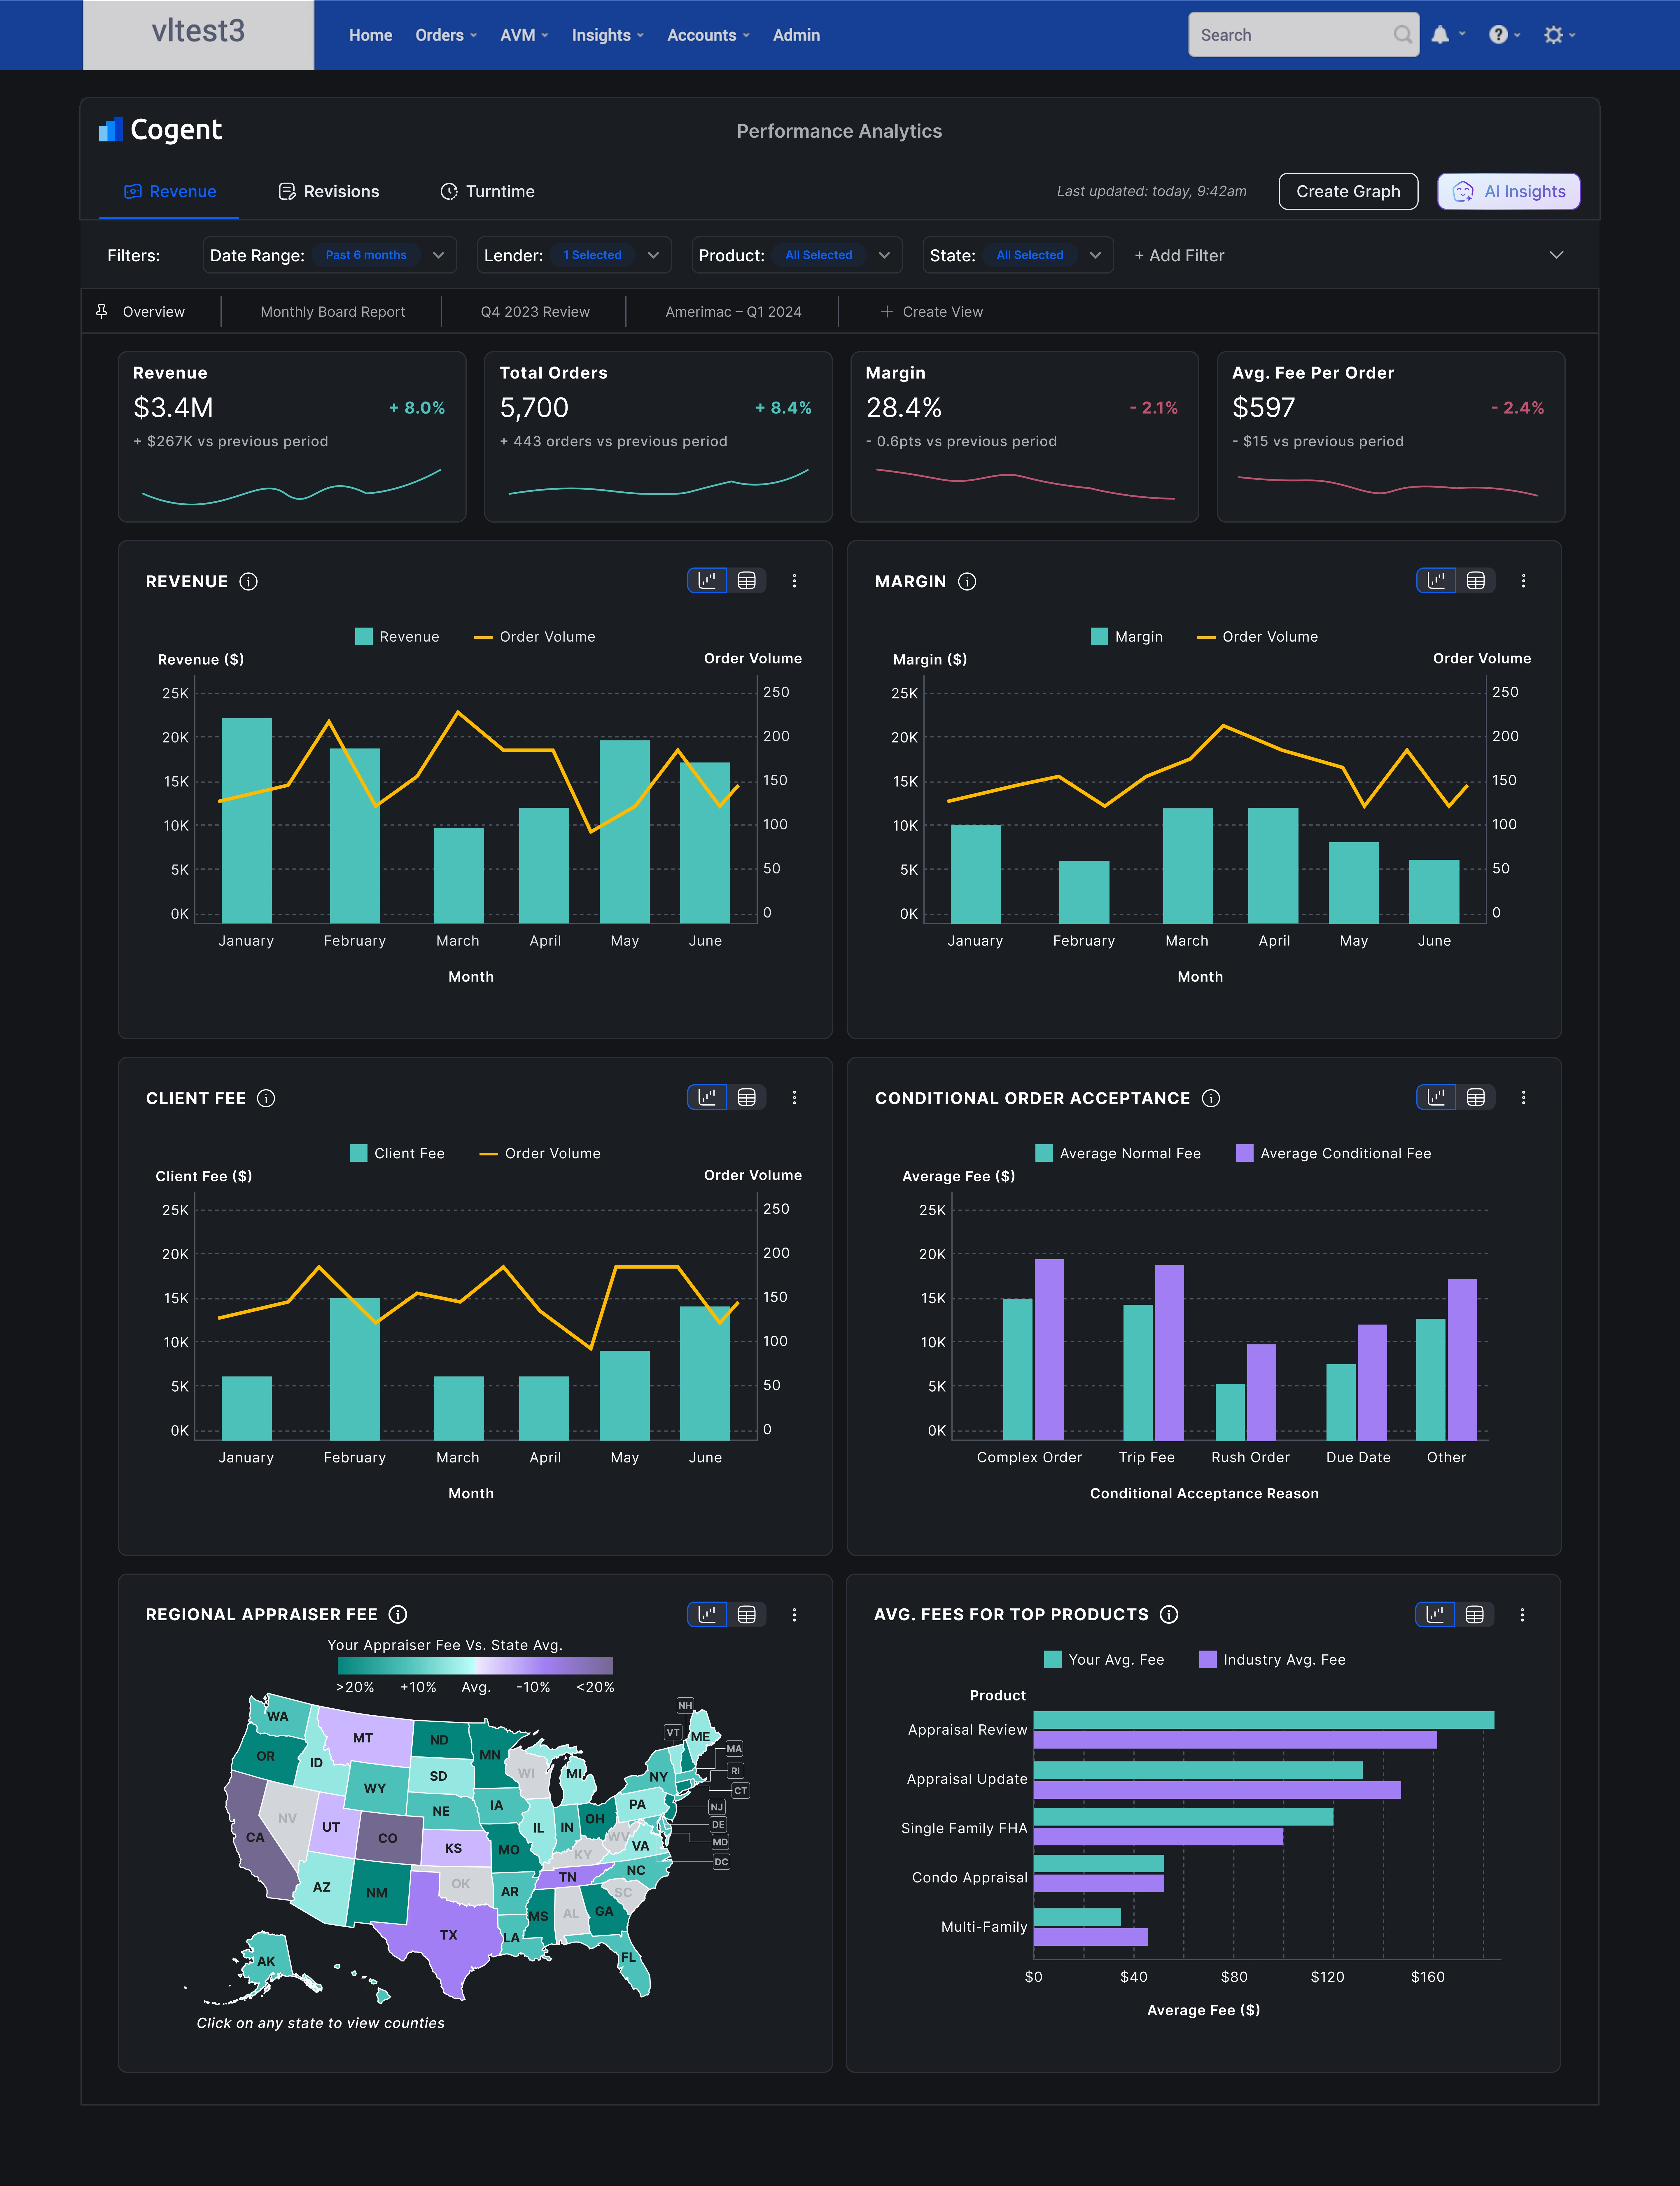
Dark Mode
Revenue Dashboard
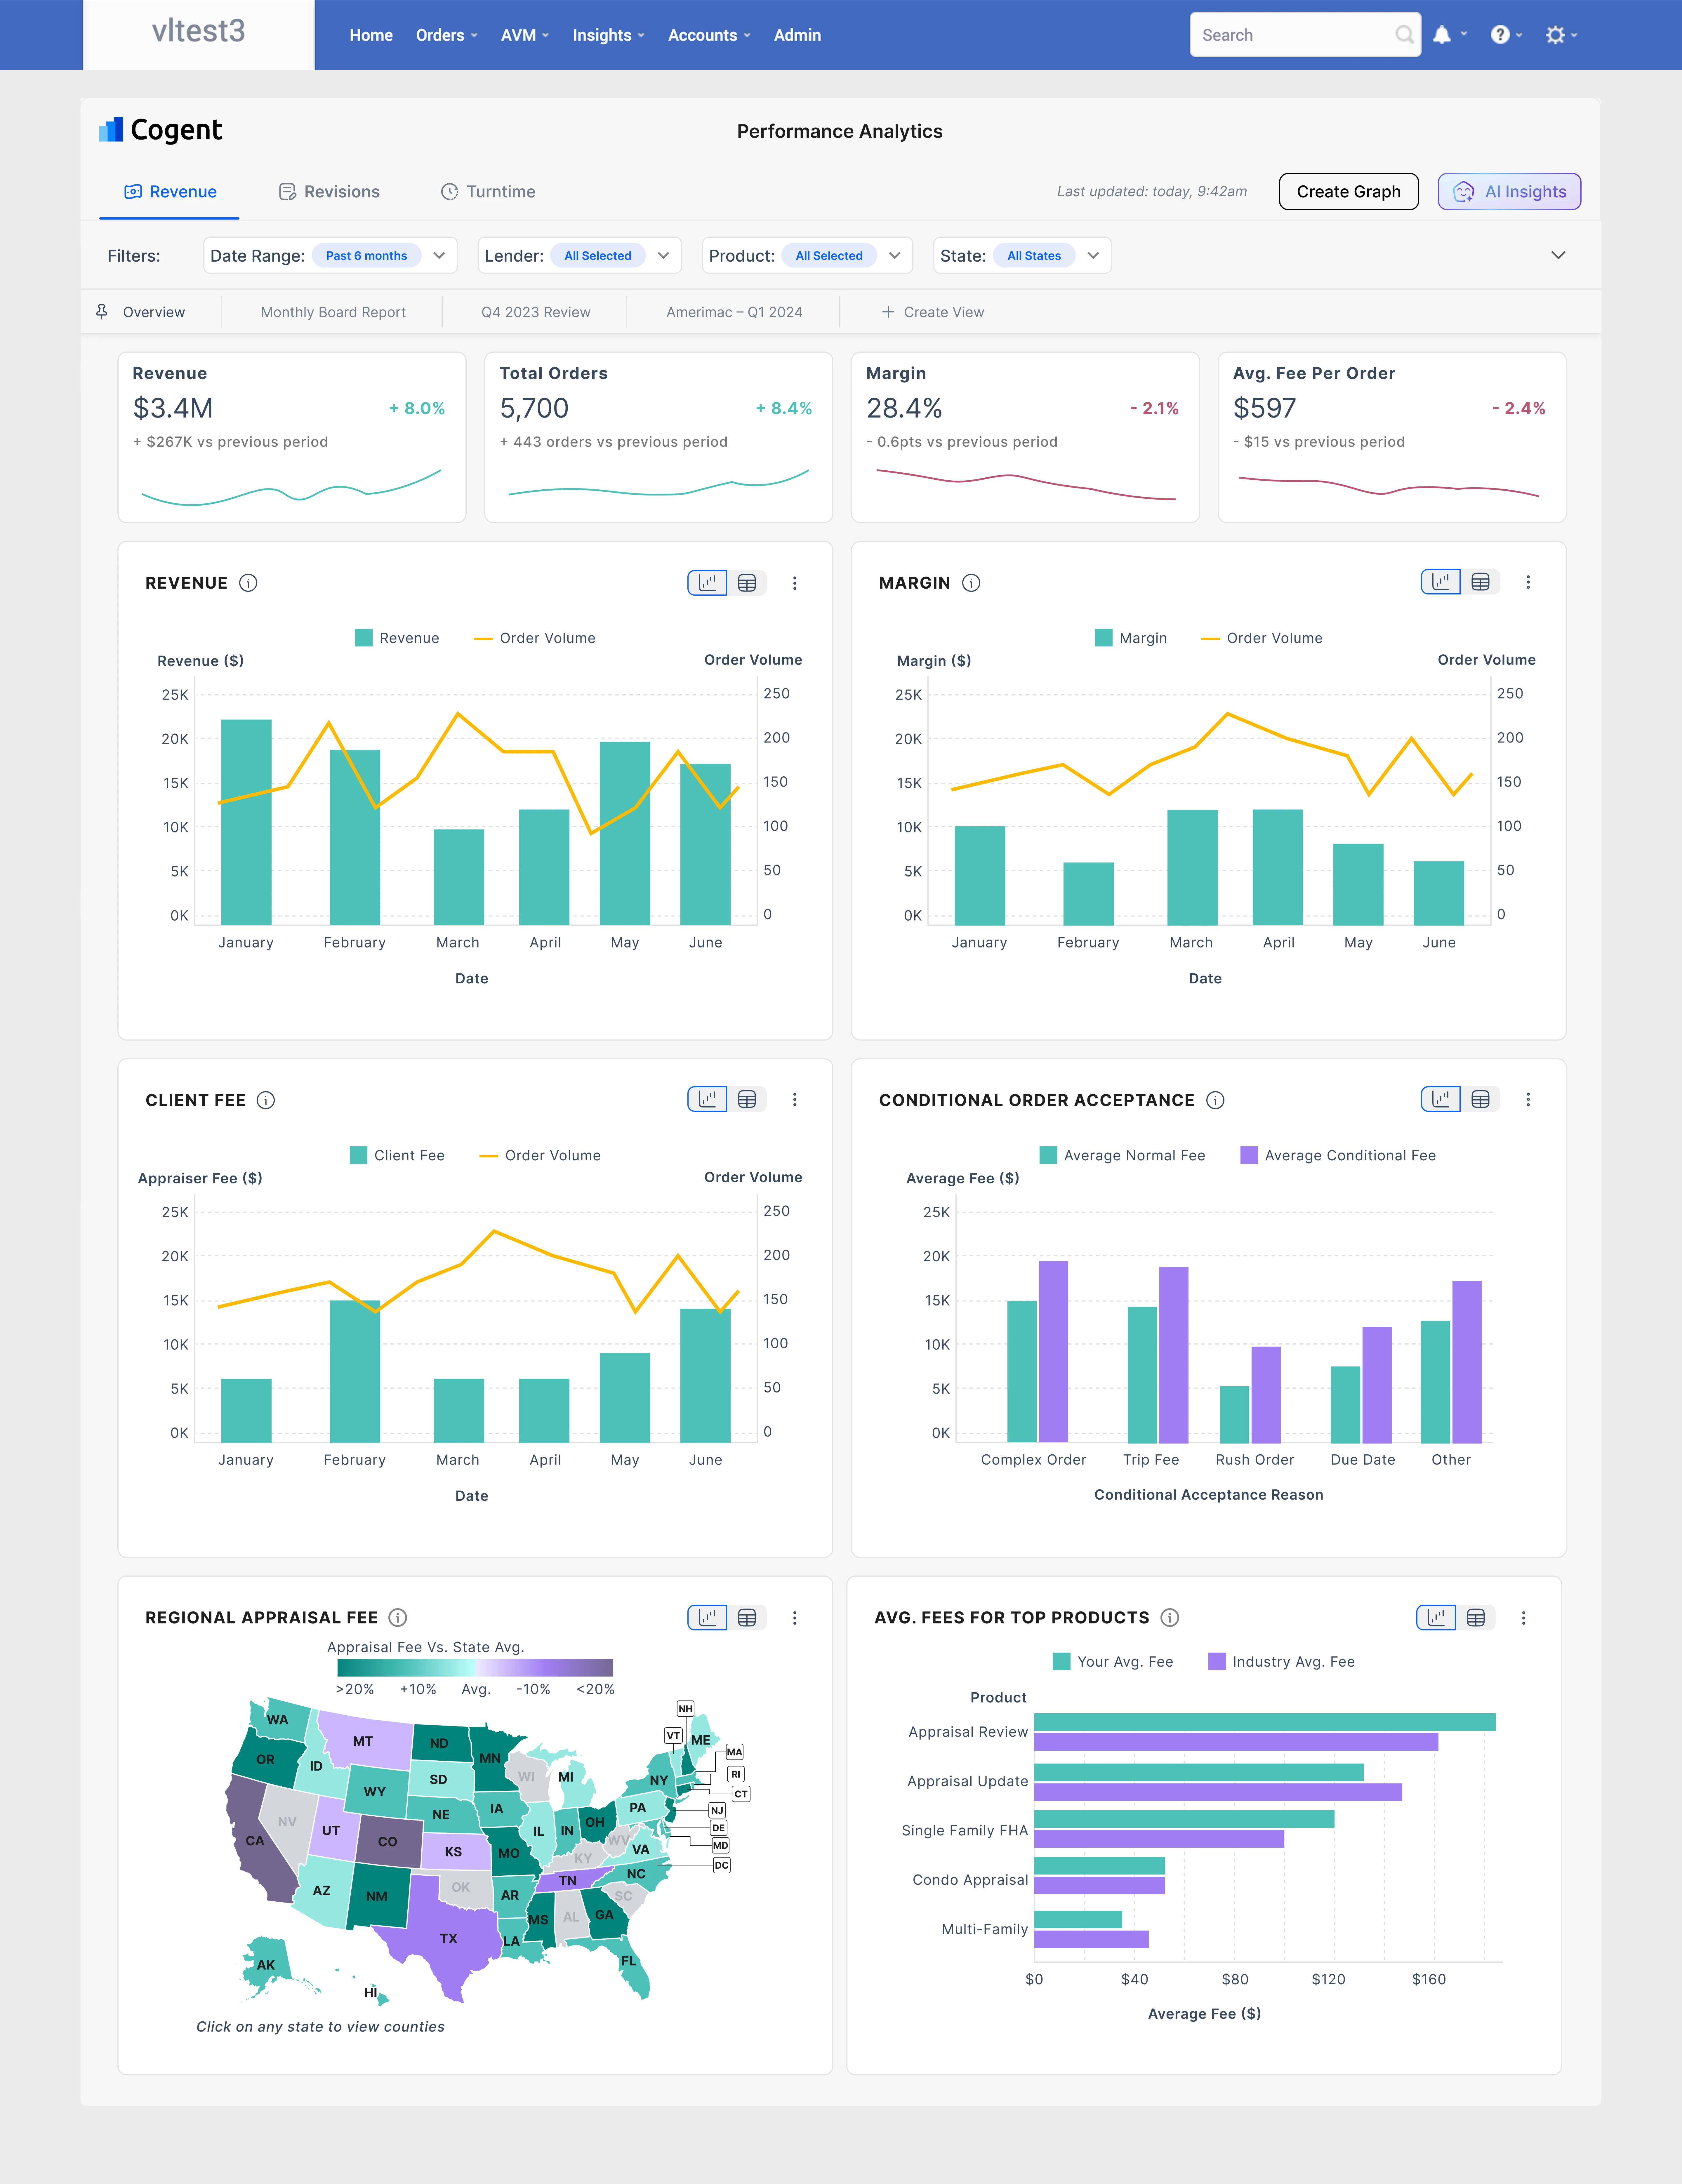
Light Mode
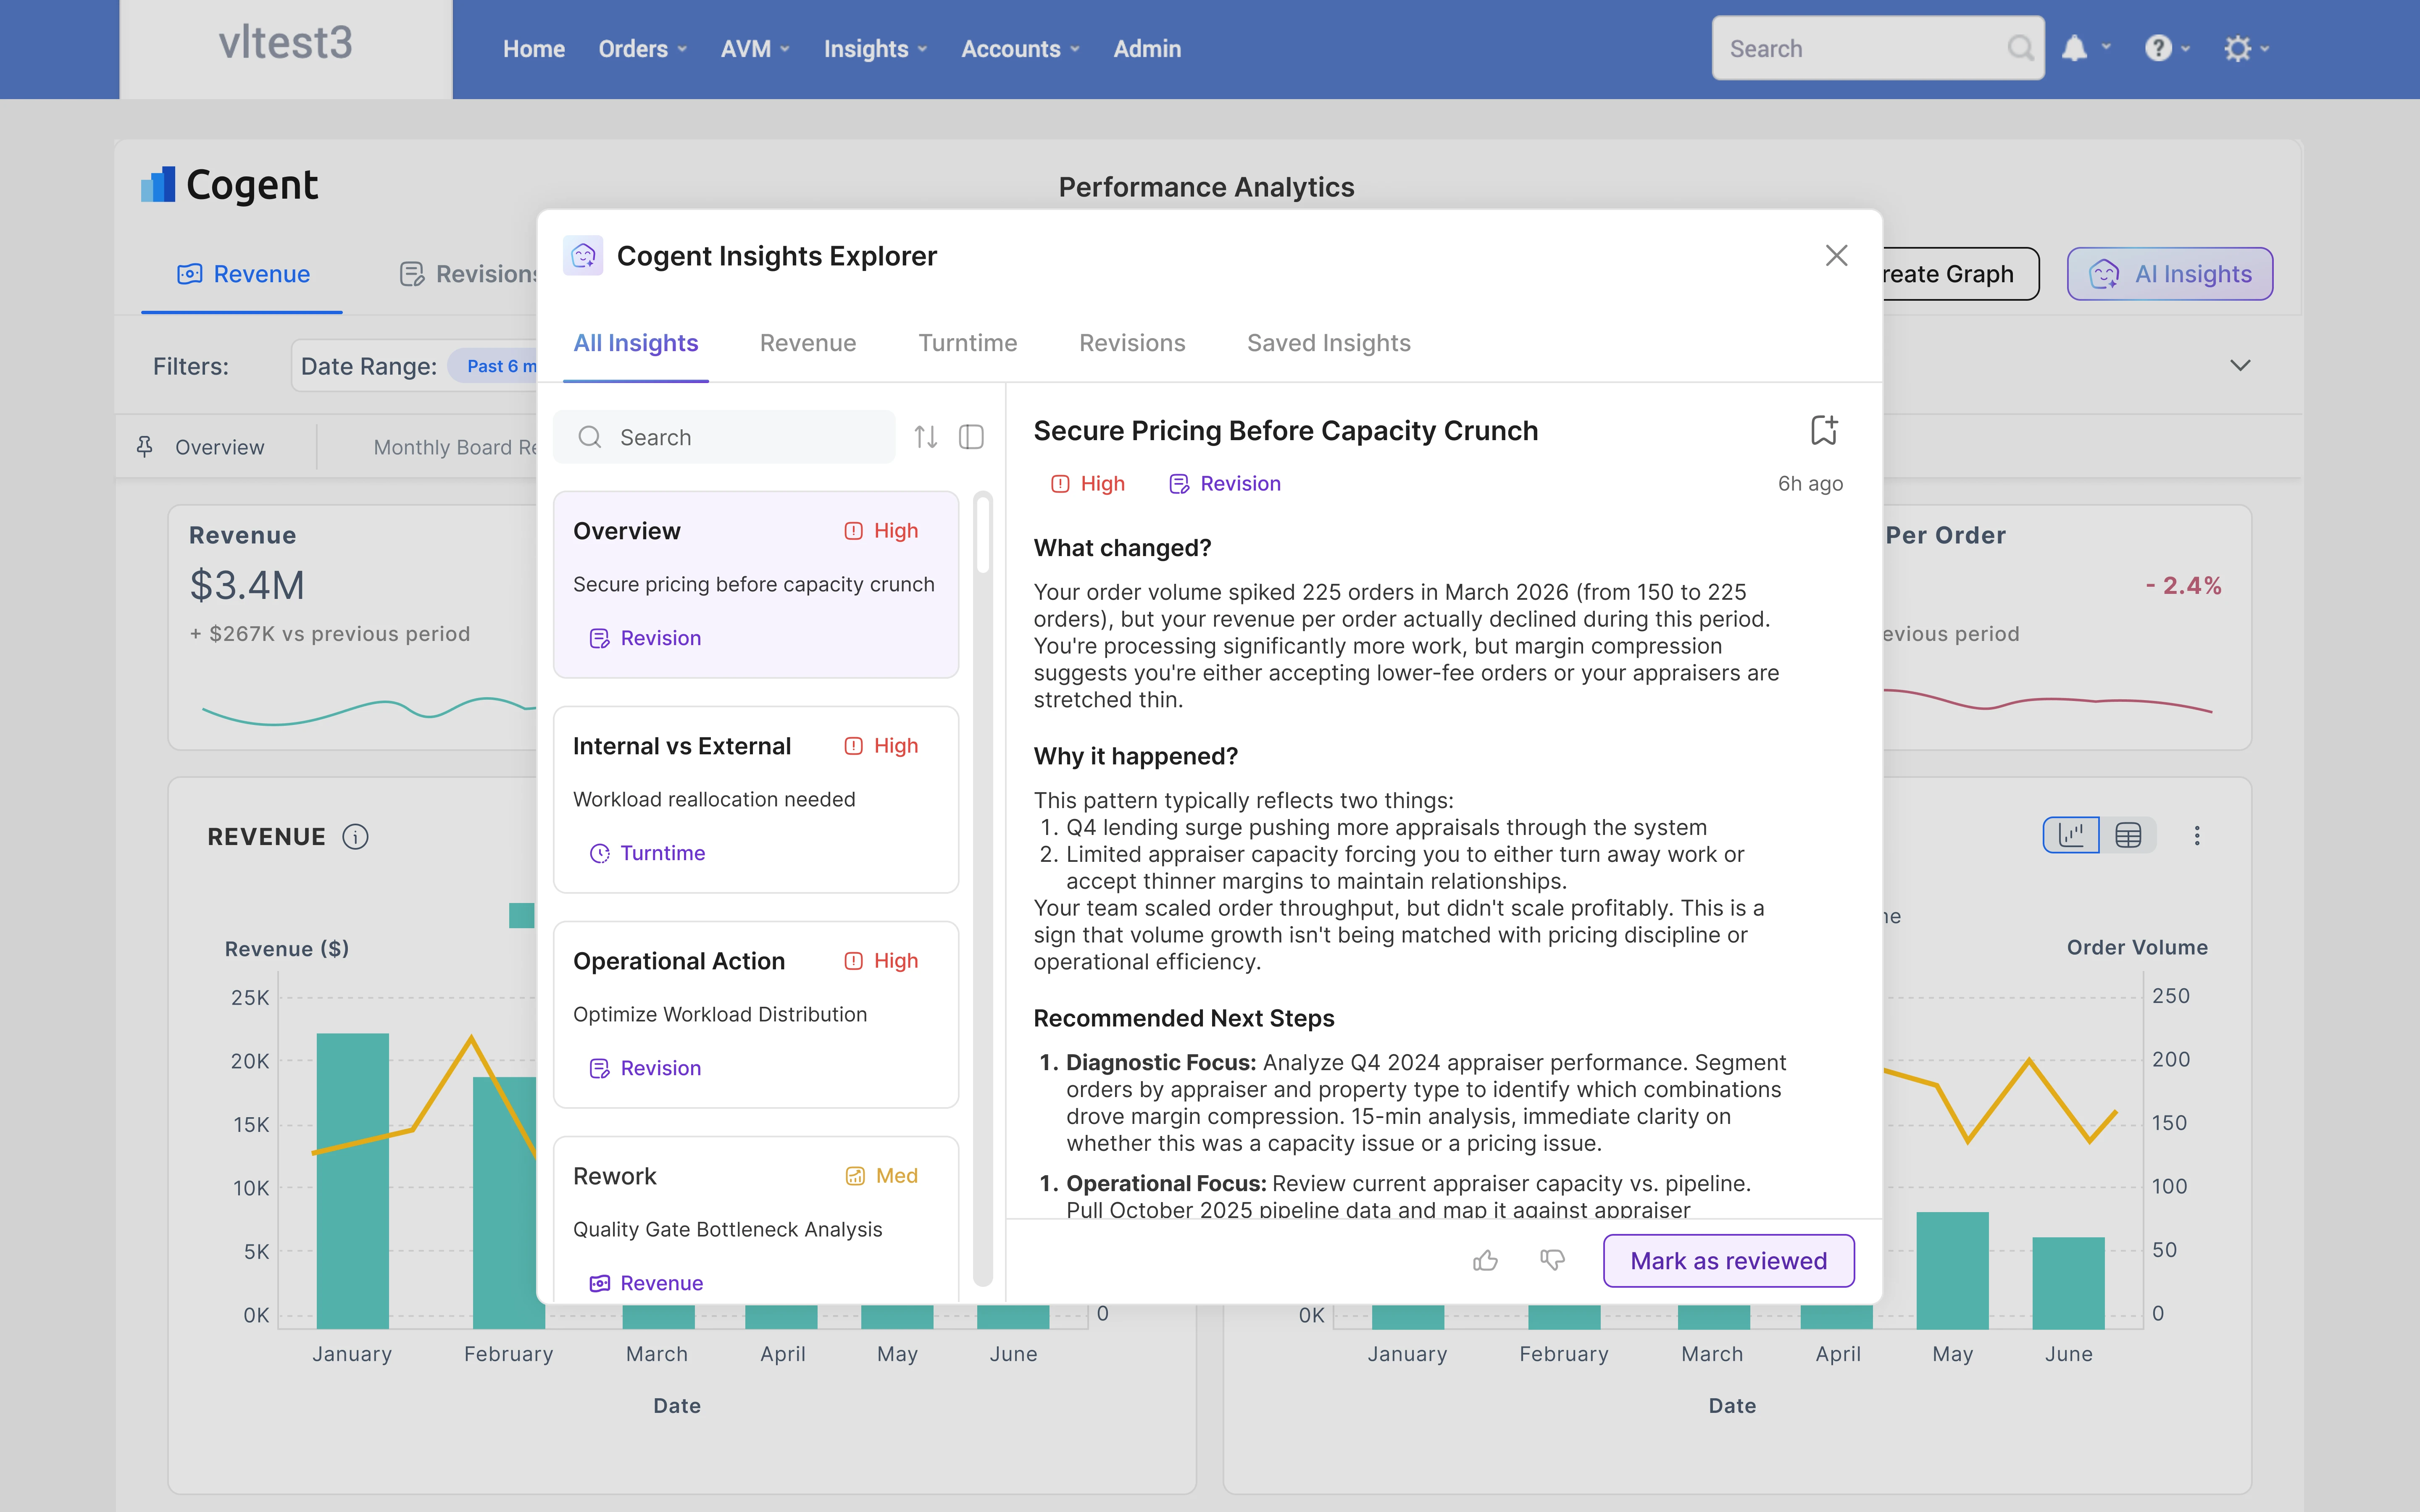
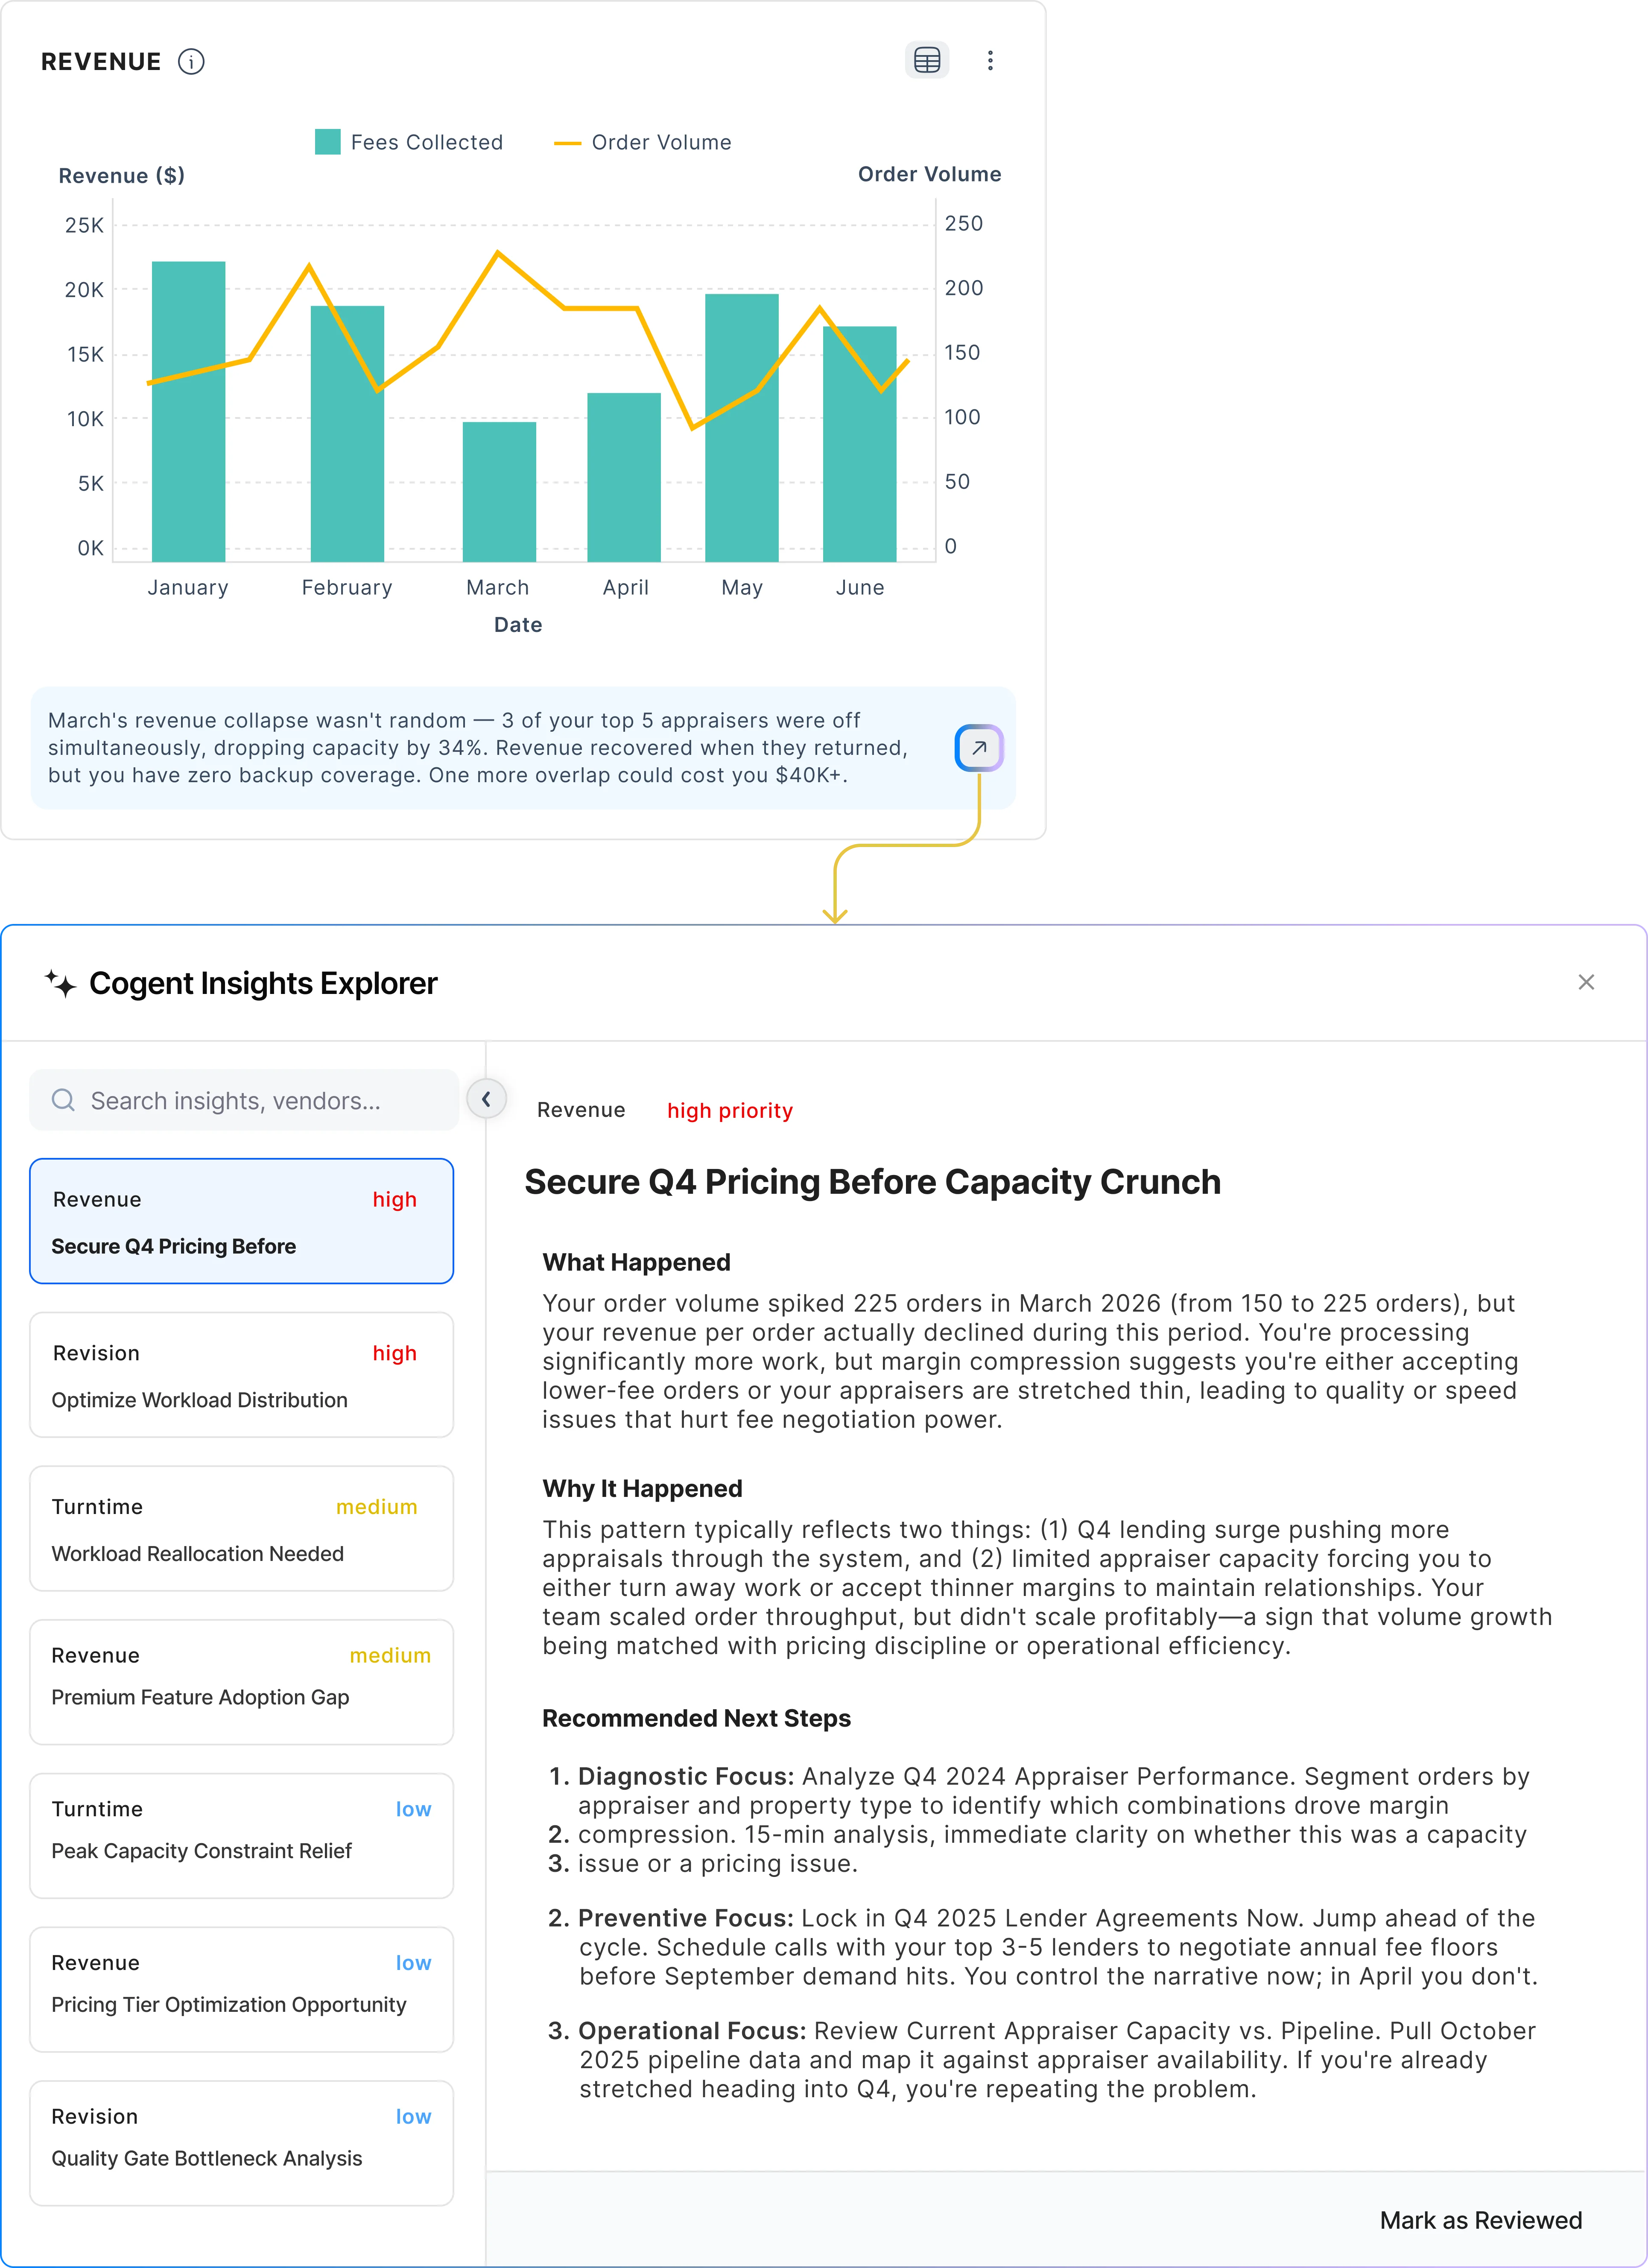
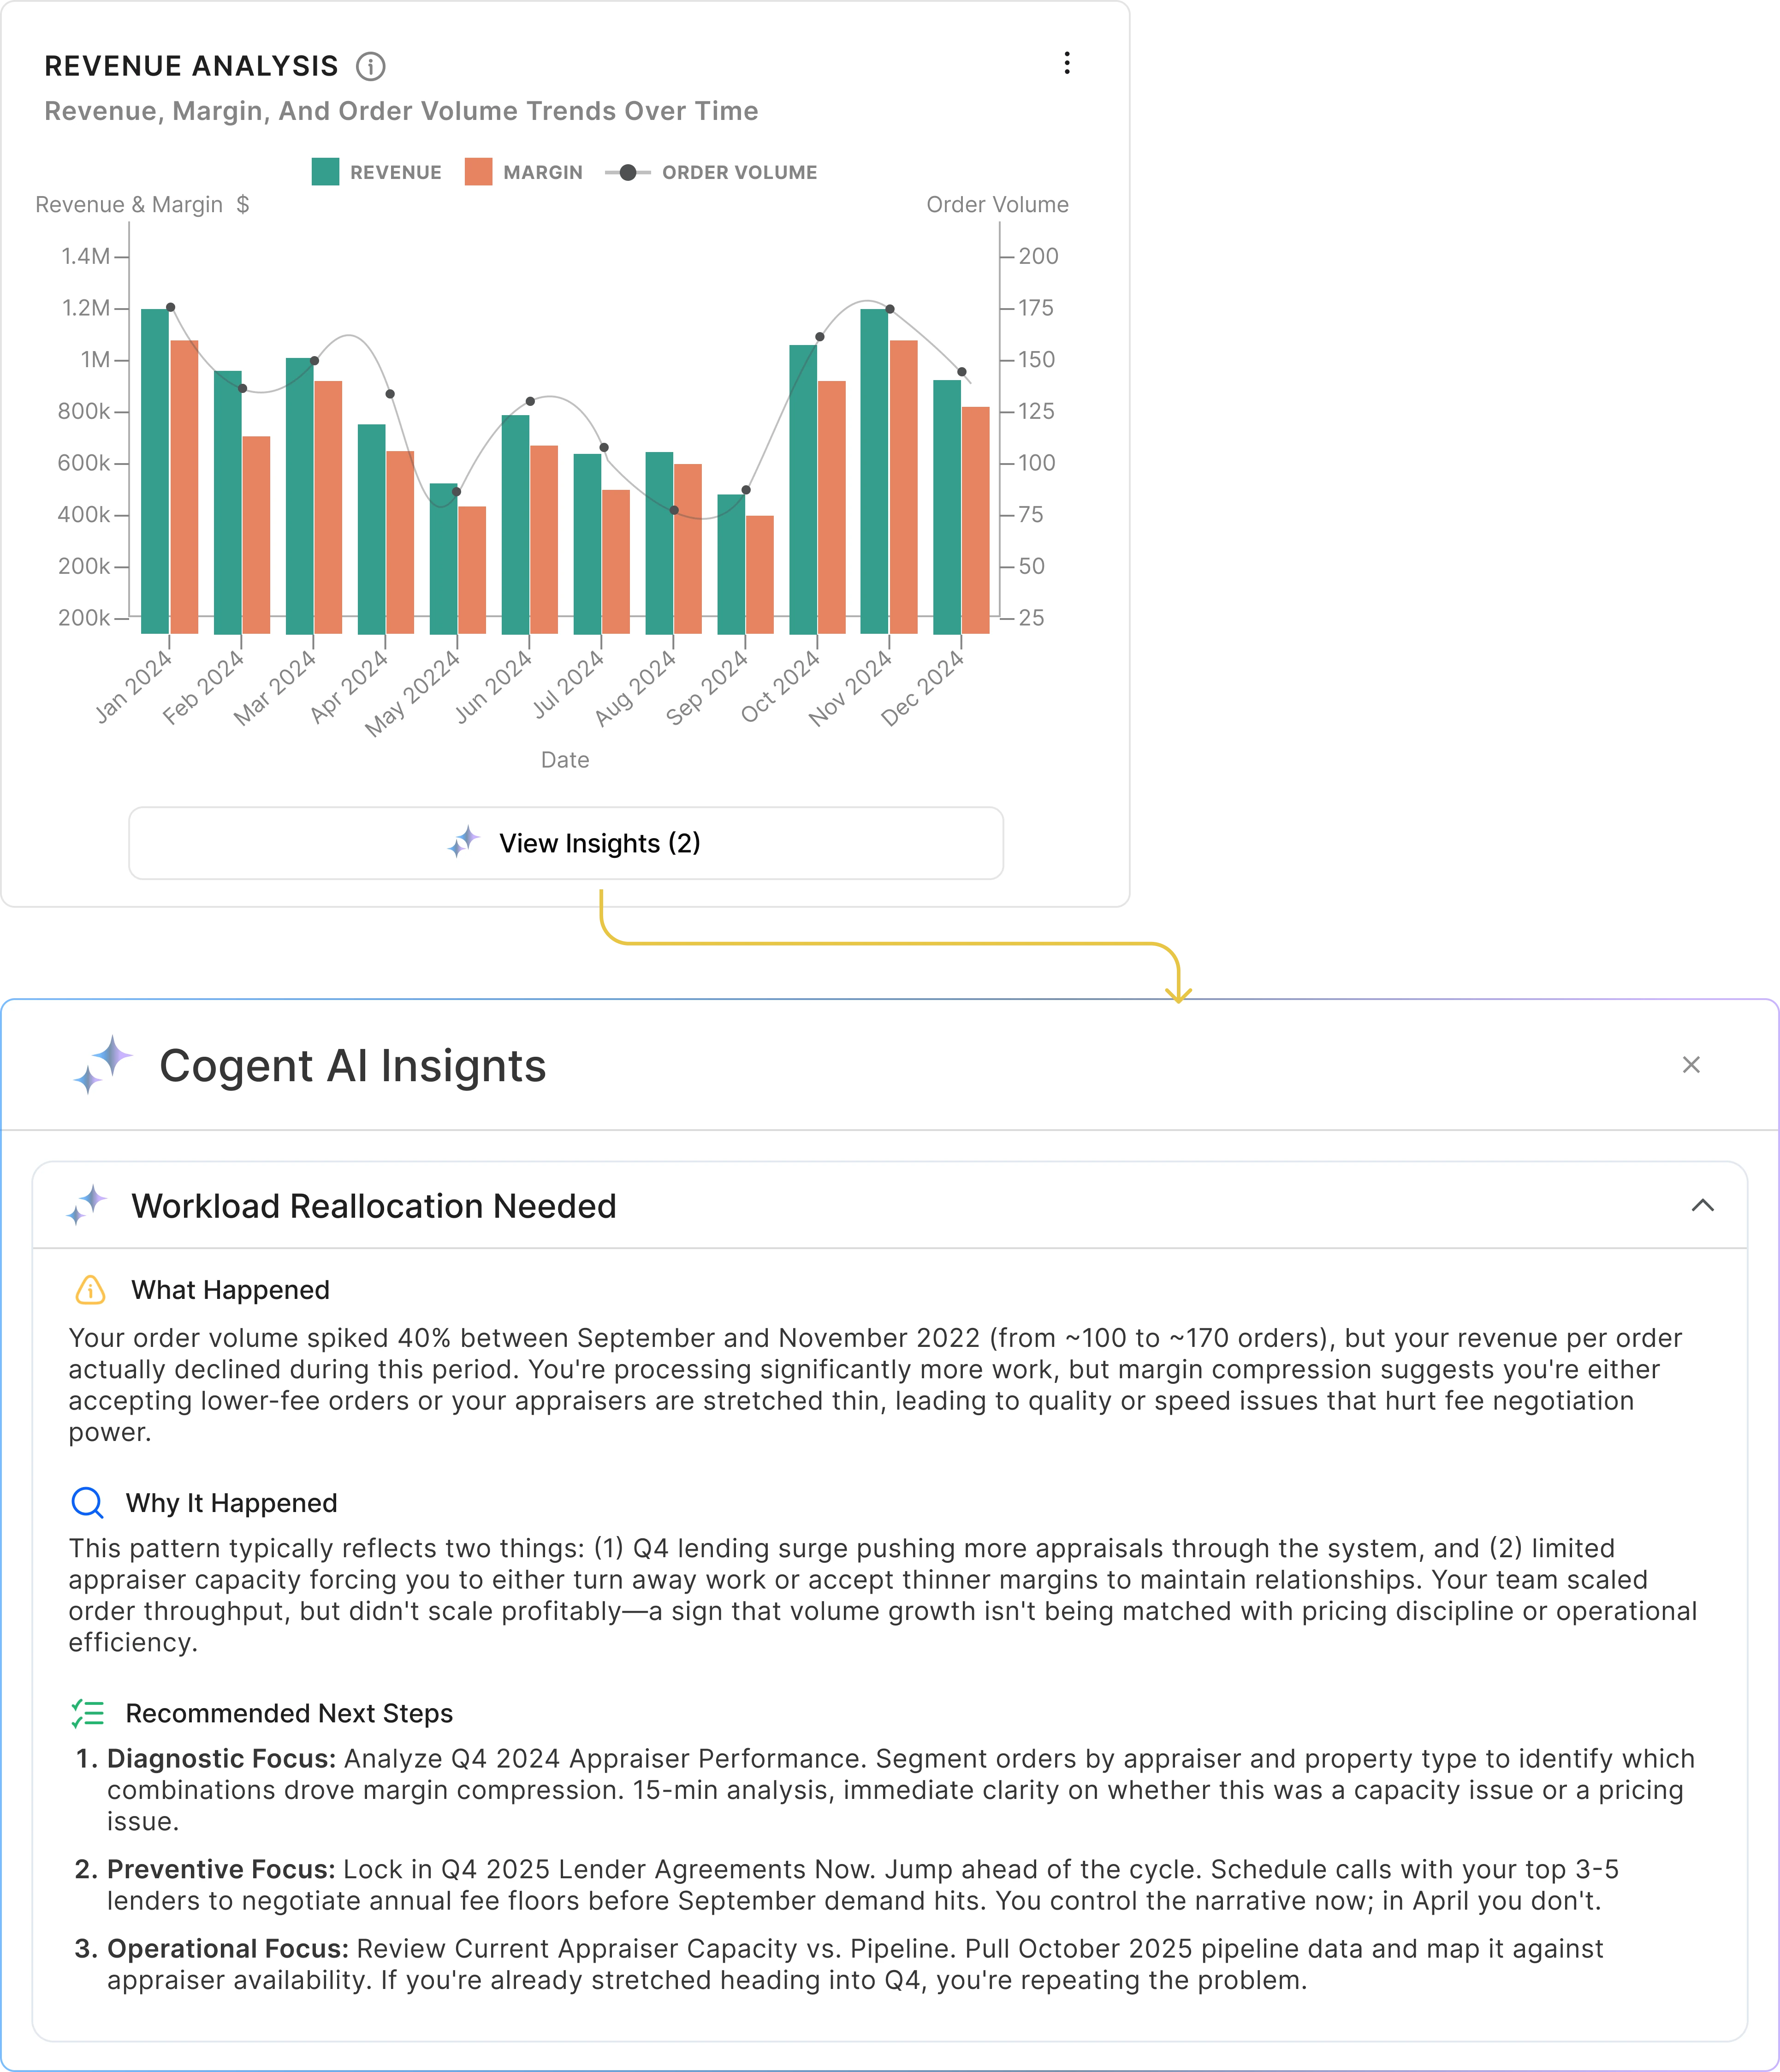
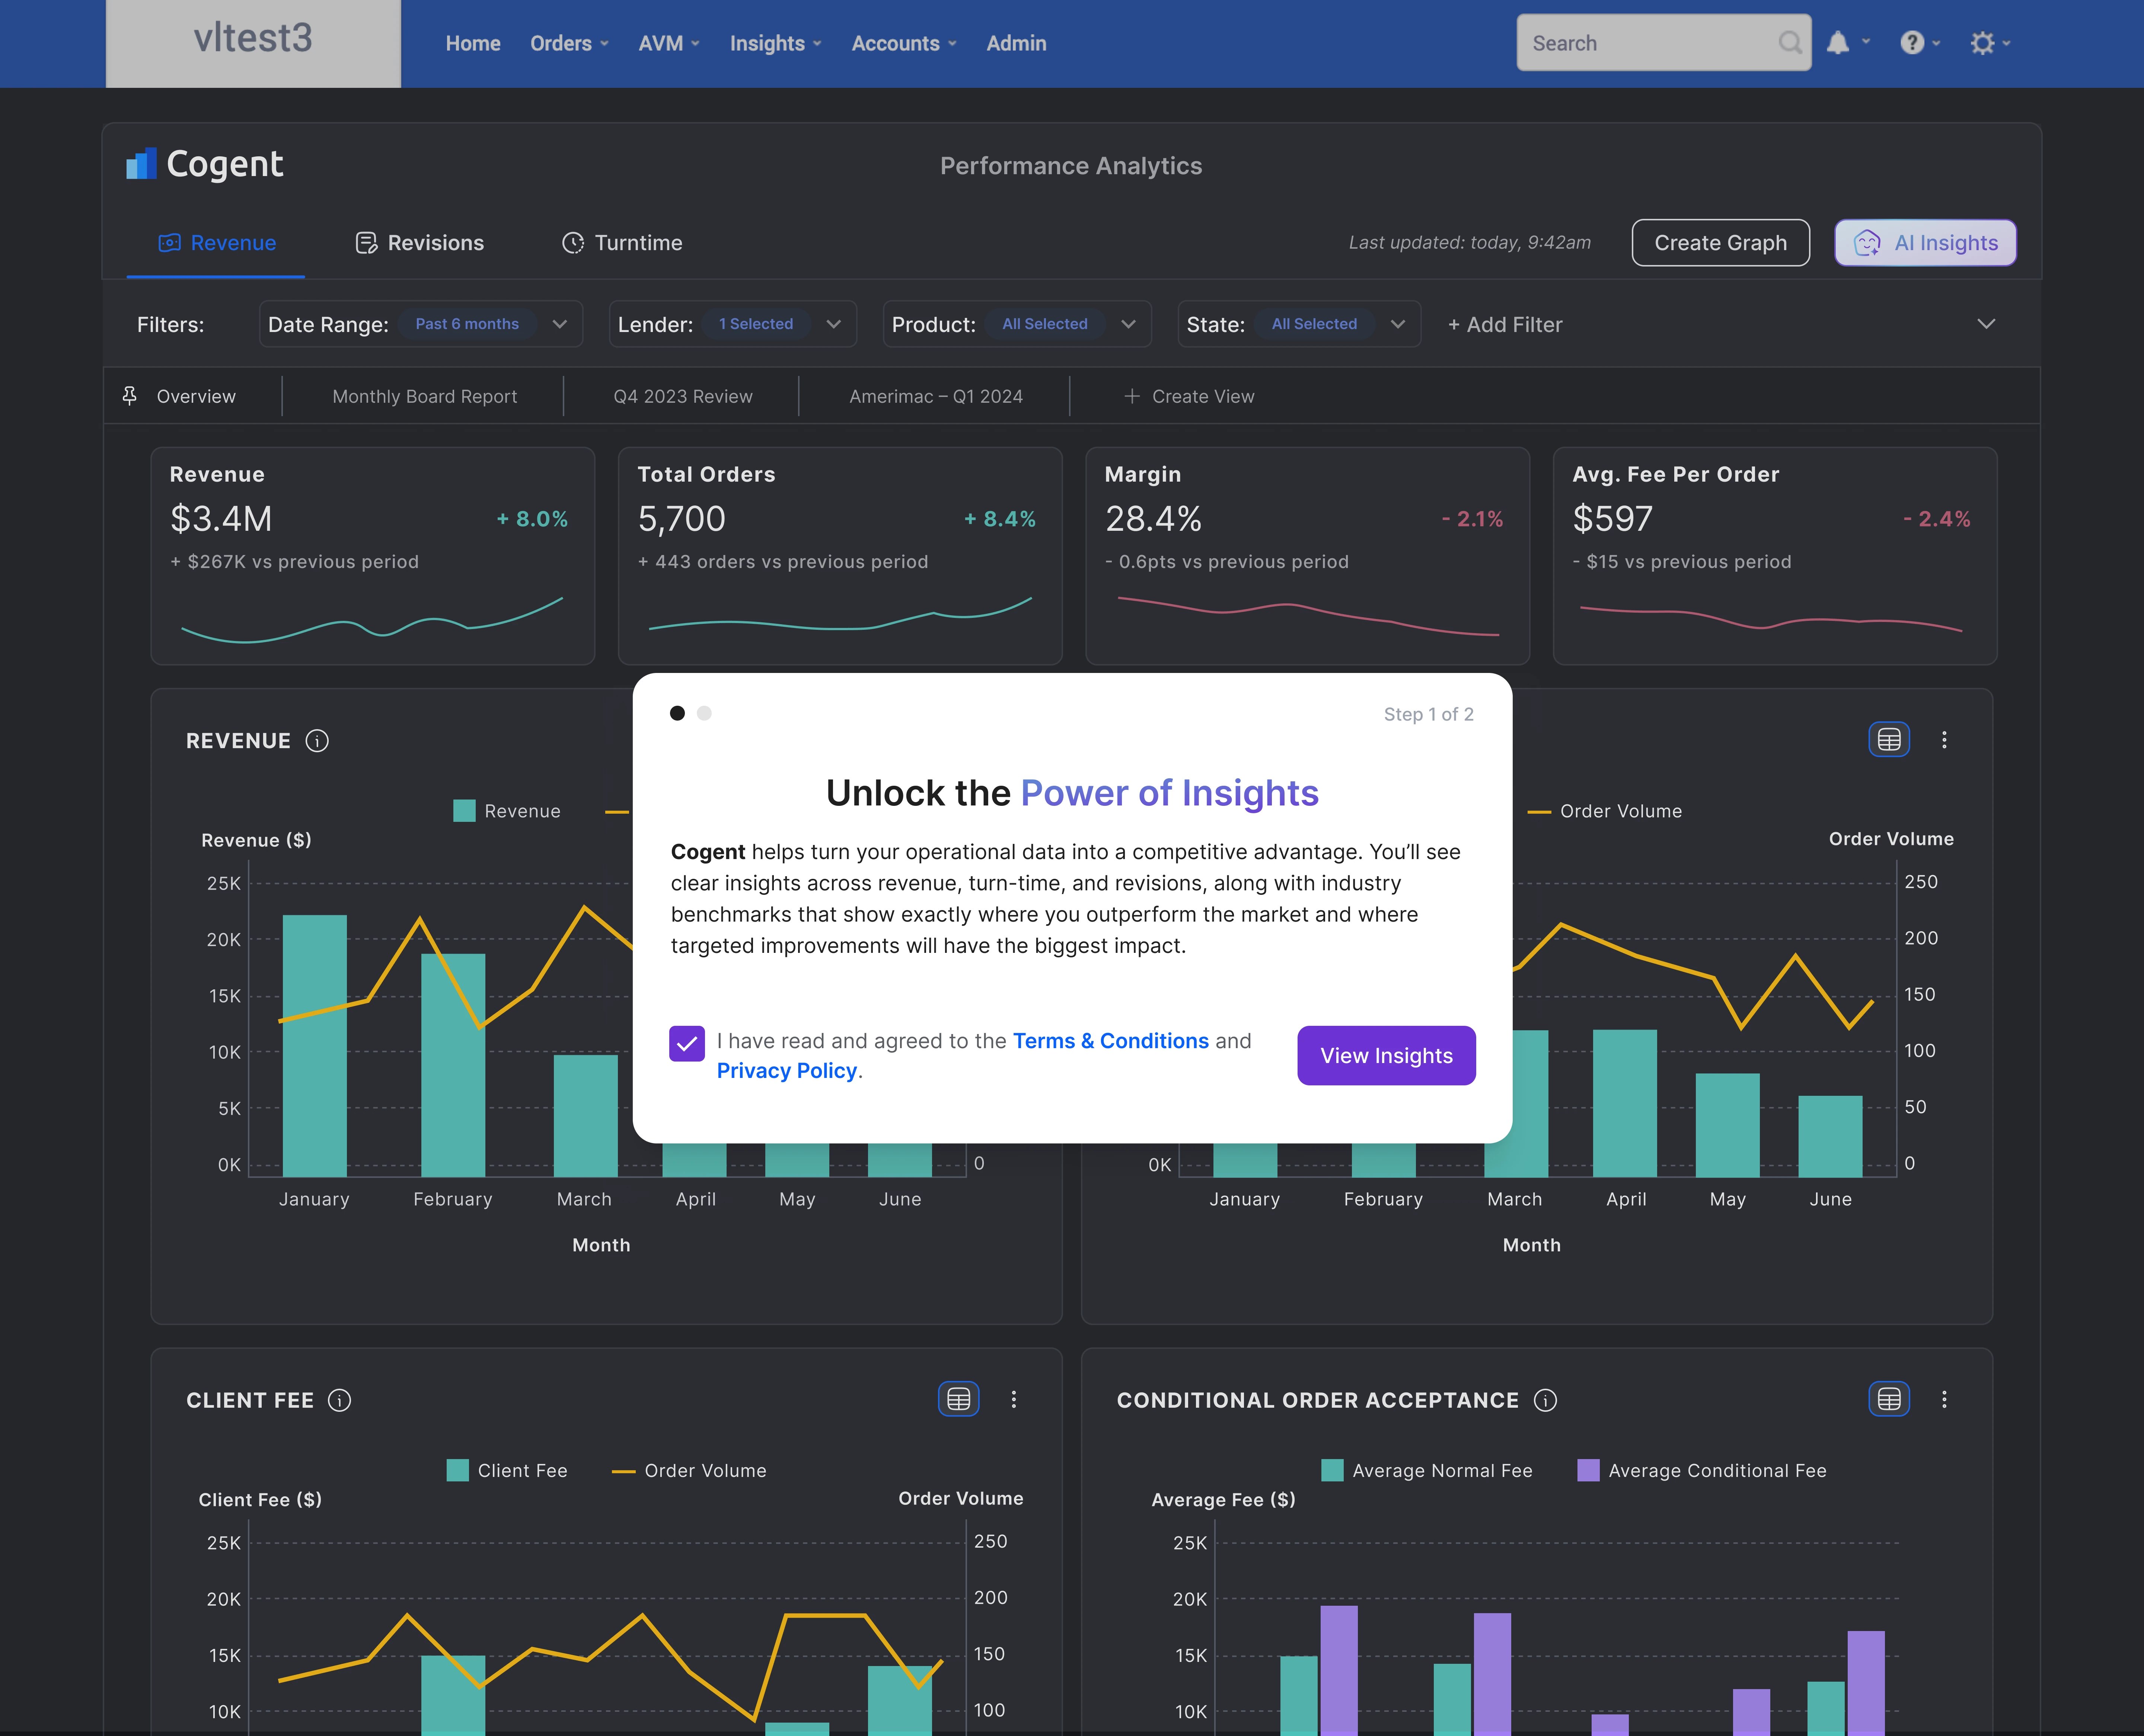
AI Insights
Final Design
Onboarding
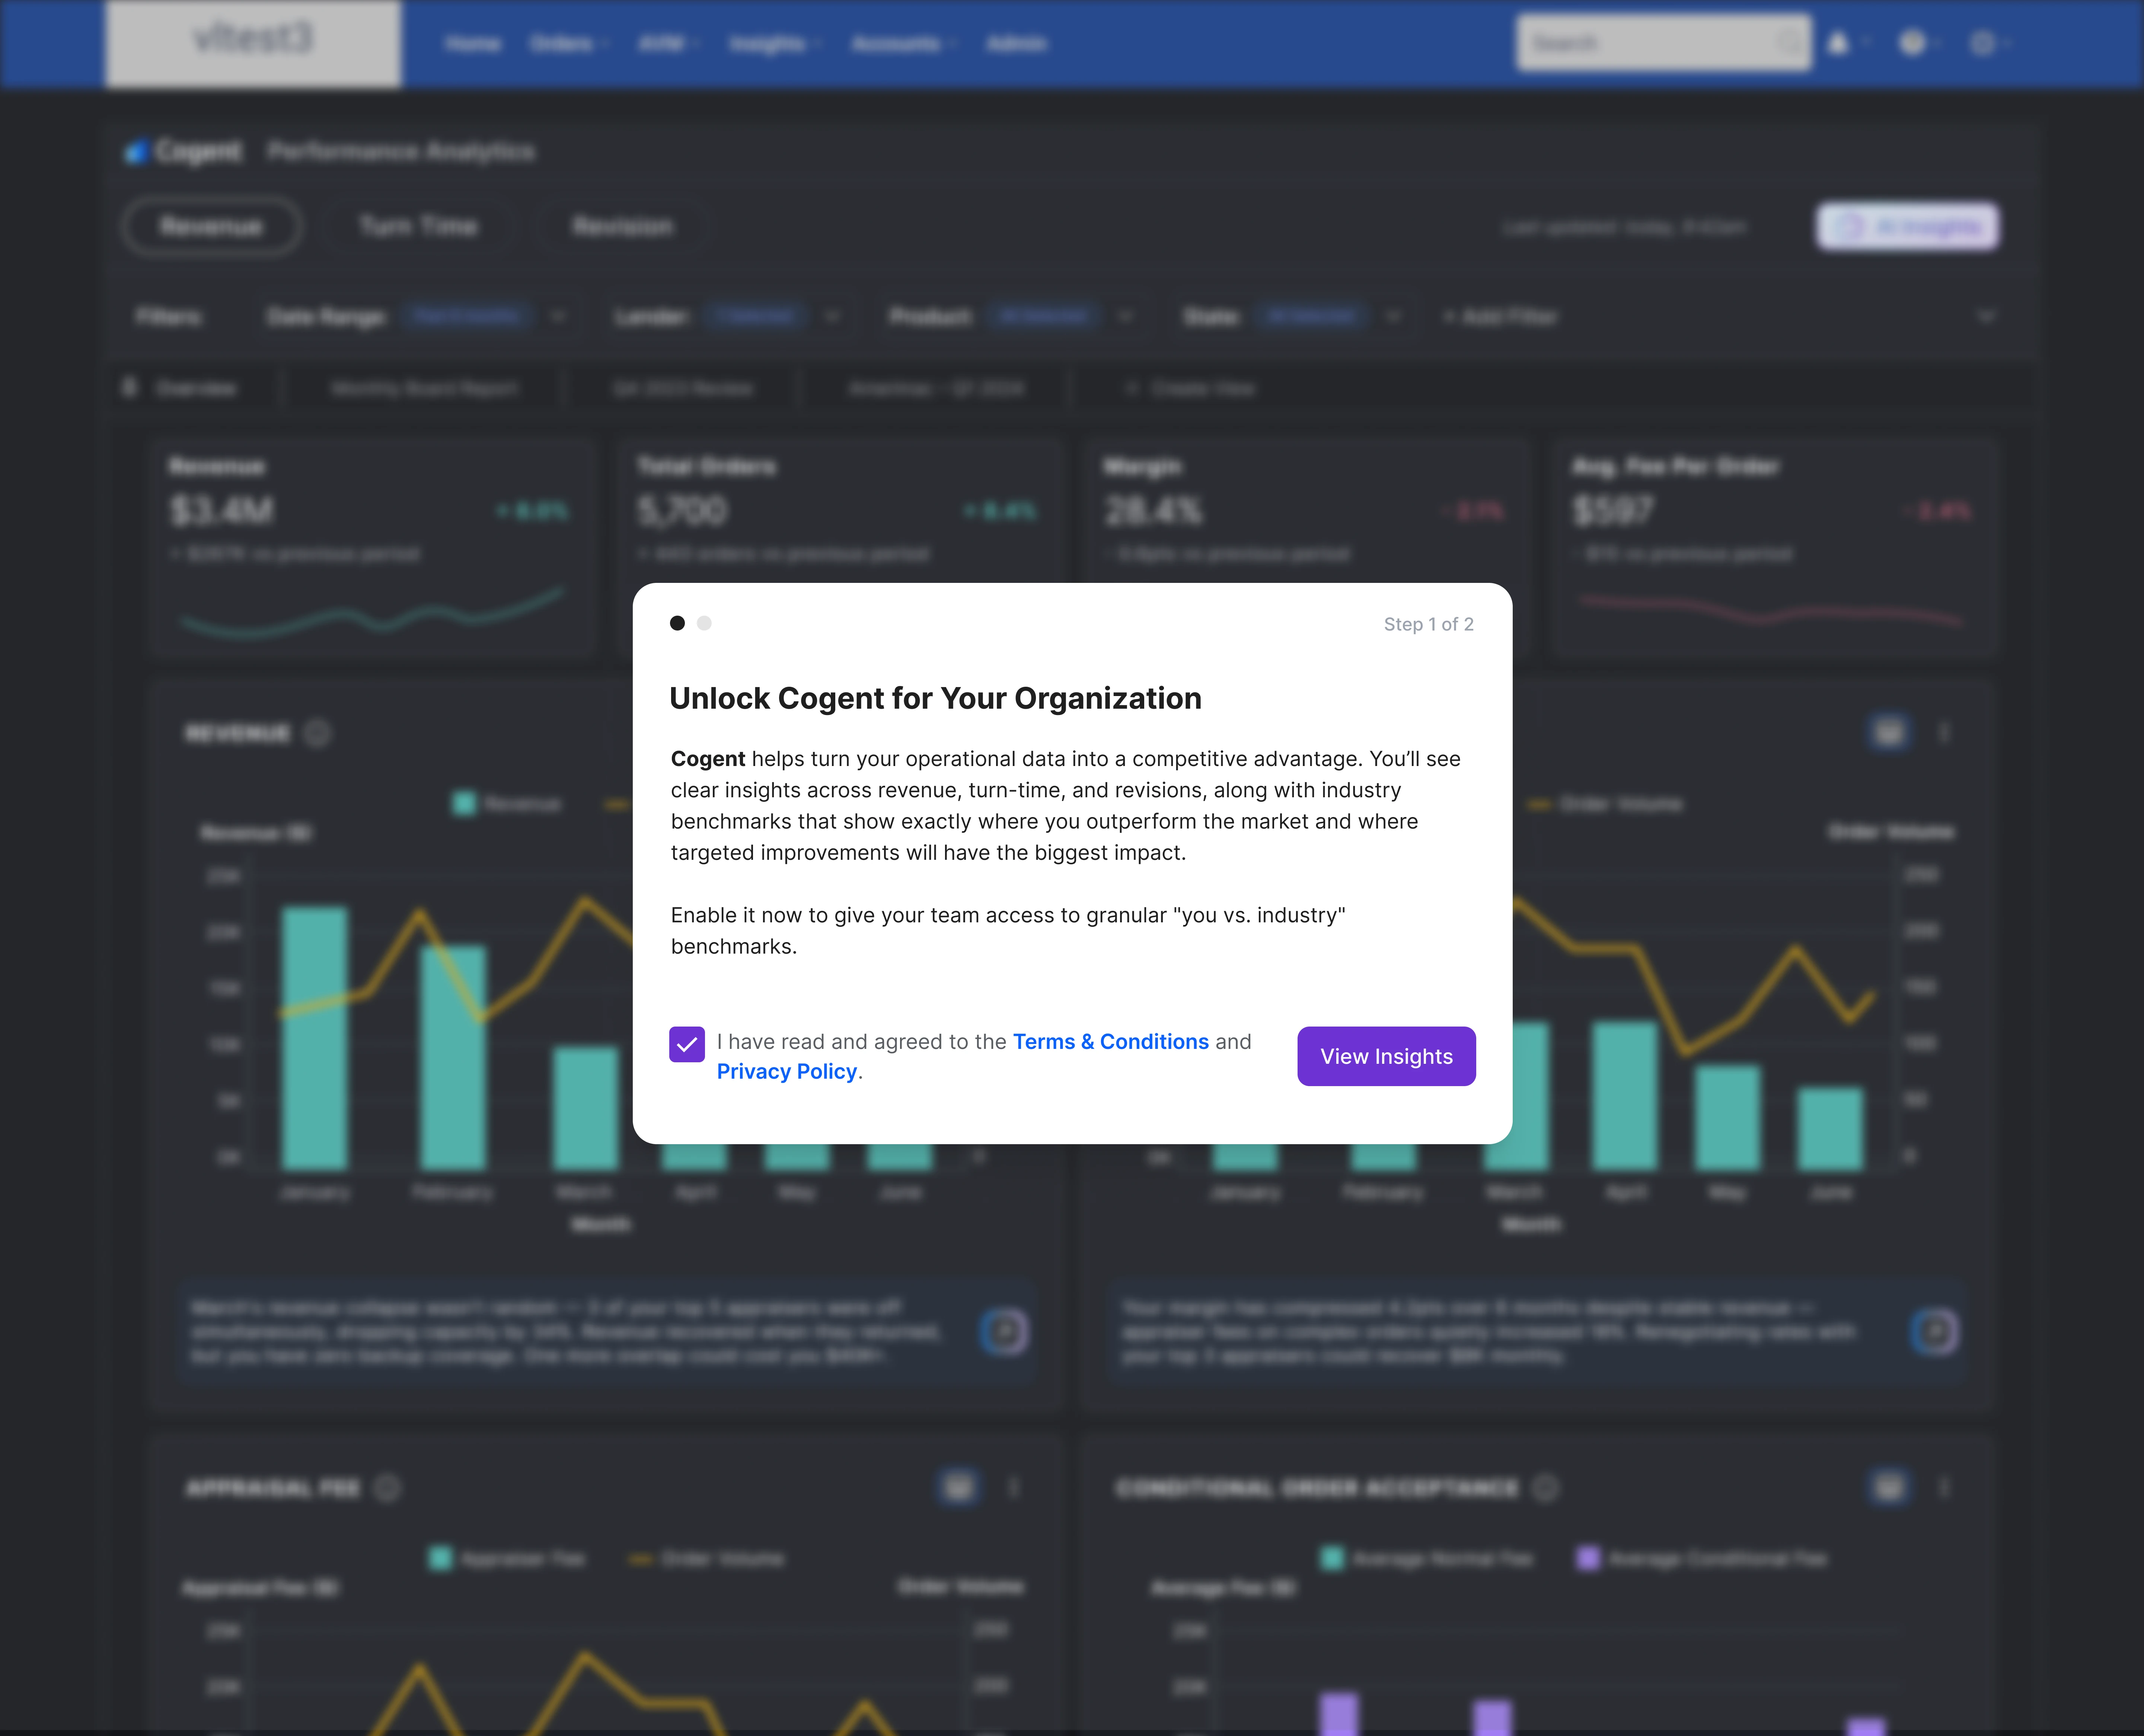
Performance dashboards in Cogent surface sensitive competitive data including operational metrics, fees, and margin analysis. T&C acceptance was required to establish explicit consent around data ownership, usage rights, and how comparative insights are generated across both AMC and lender user bases.
Final flow
- Since Cogent is embedded into Core, all users are already onboarded to Core.
- I identified organizational decision-makers already active on Core.
- I built a targeted consent flow with custom T&C modal for decision-makers only.
- Single acceptance unlocked dashboard access for entire organization.
- If decision-maker hadn't arrived at T&Cs yet, individual users can still accept on their end.
Terms & conditions according to roles
T&C for Decision Makers
T&C for Other Users
Terms & conditions acceptance journey
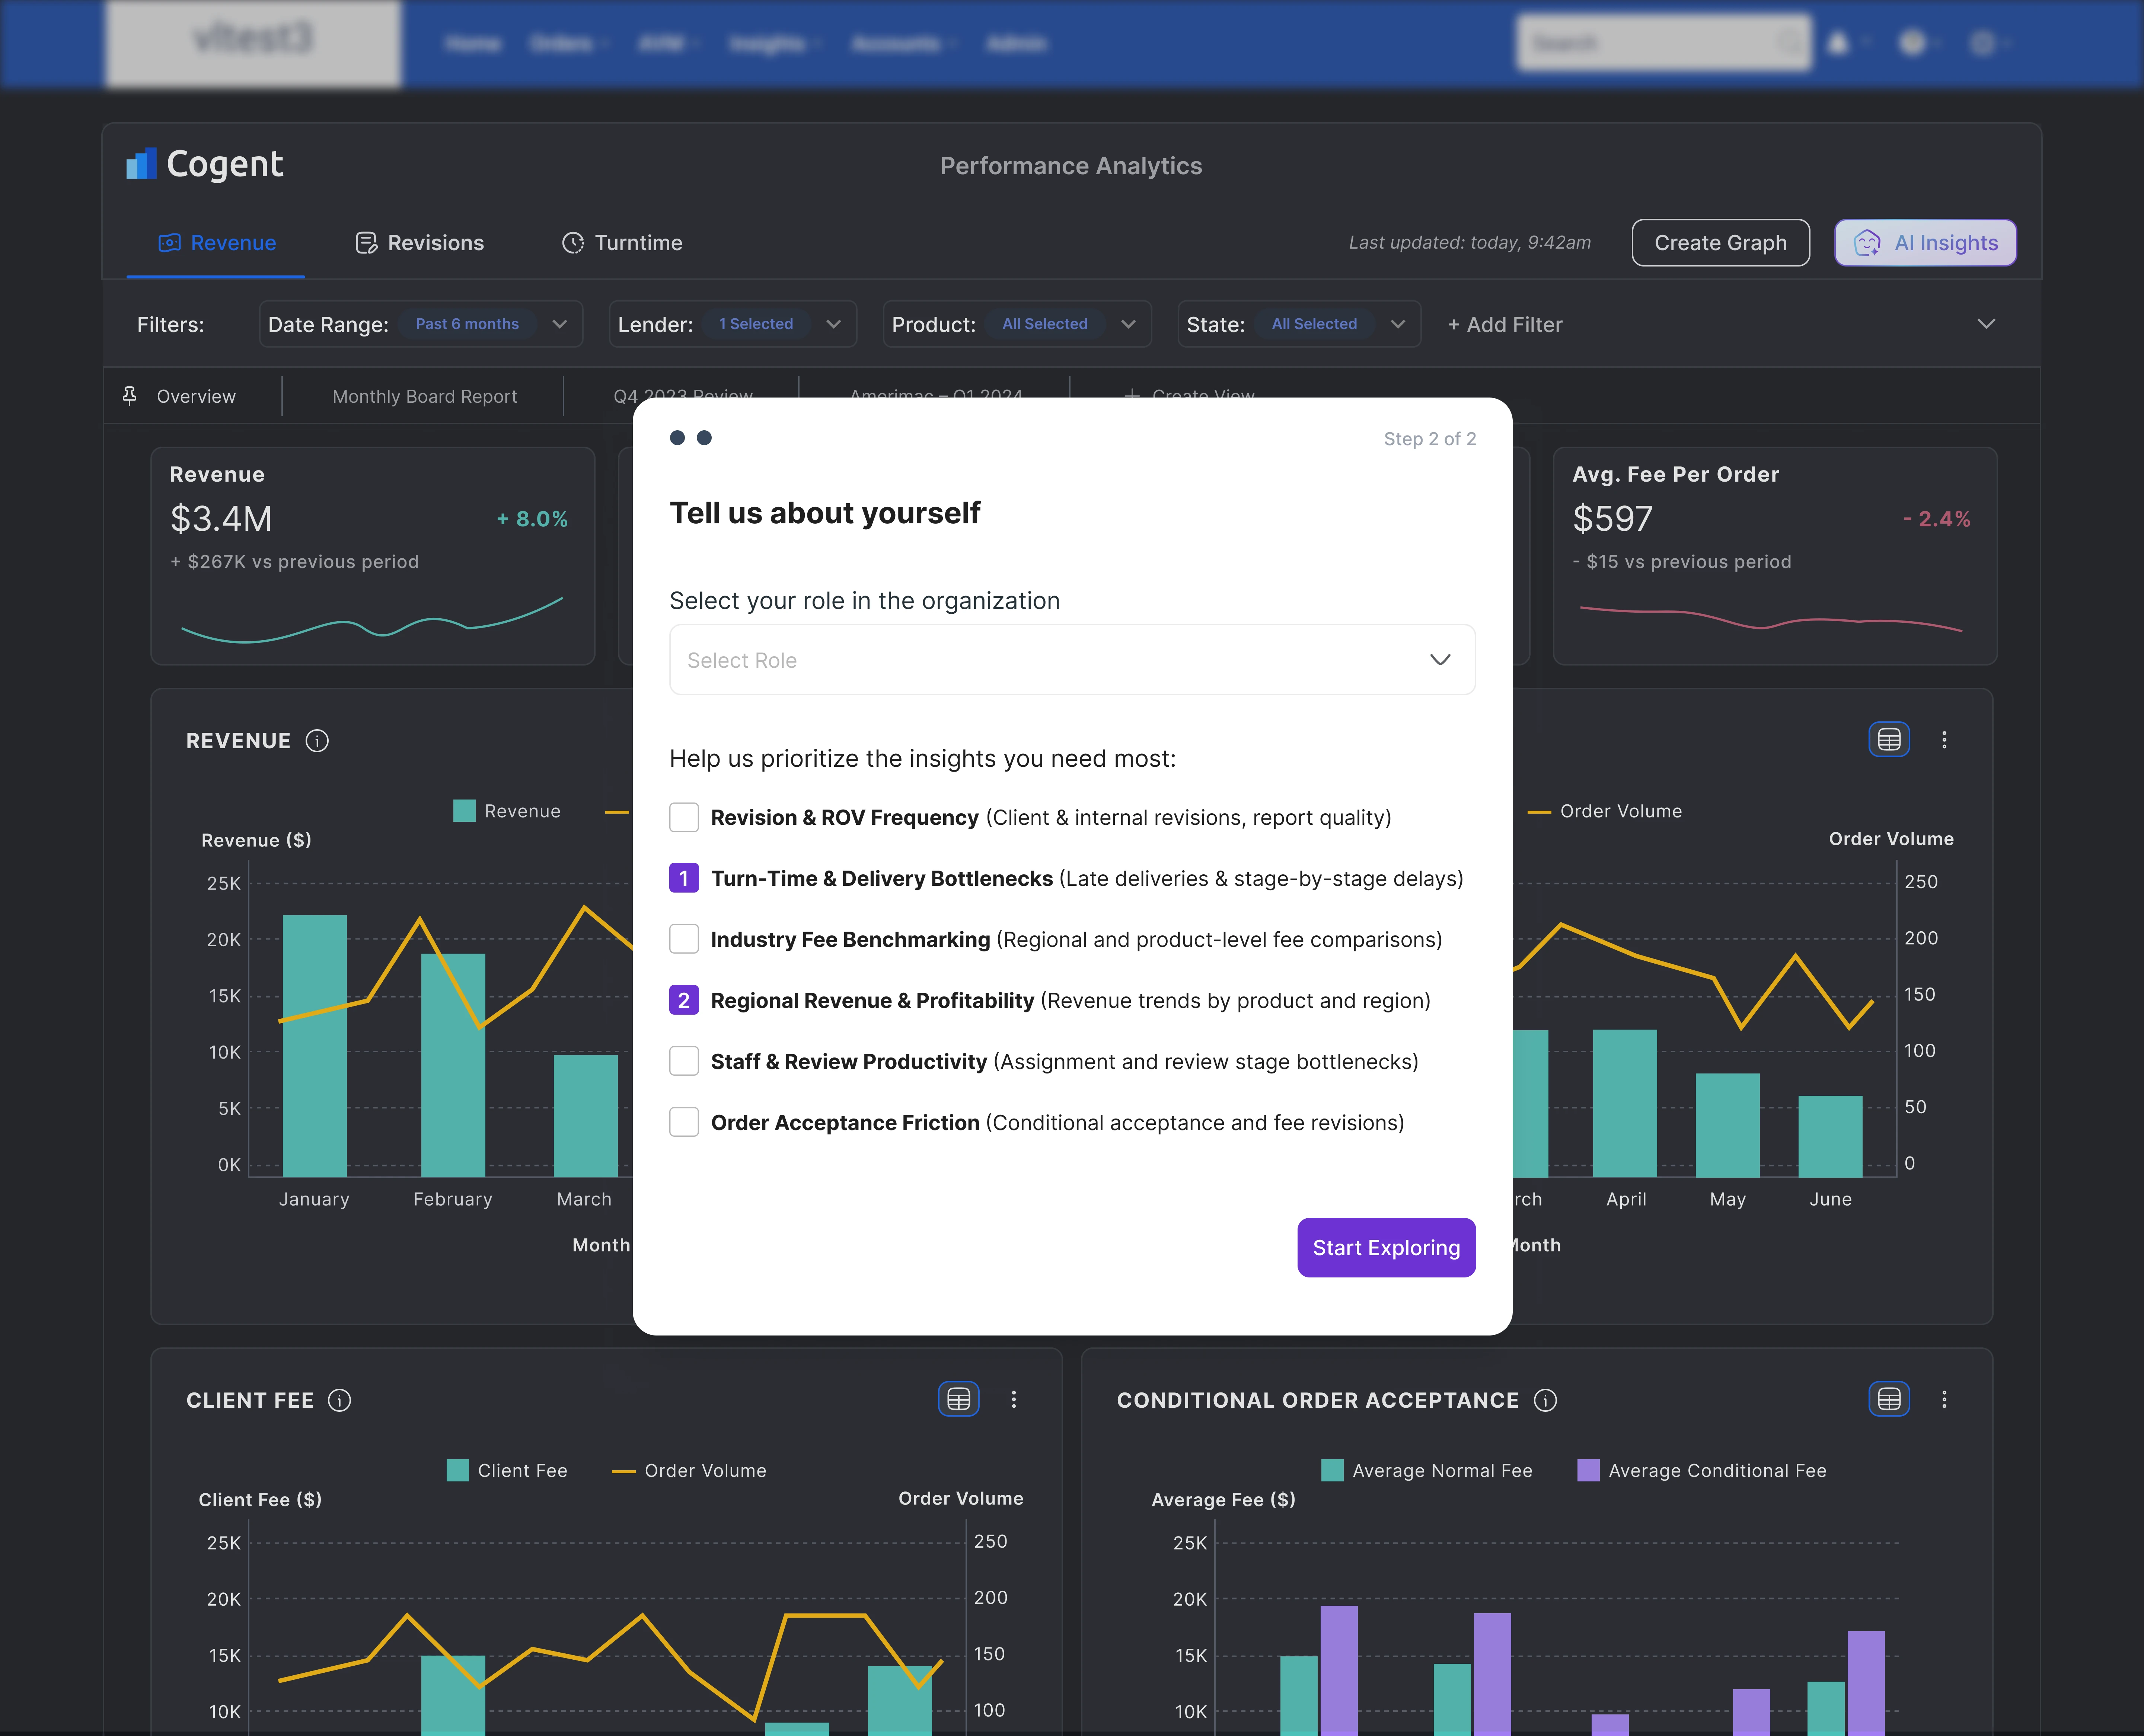
Role and Uses
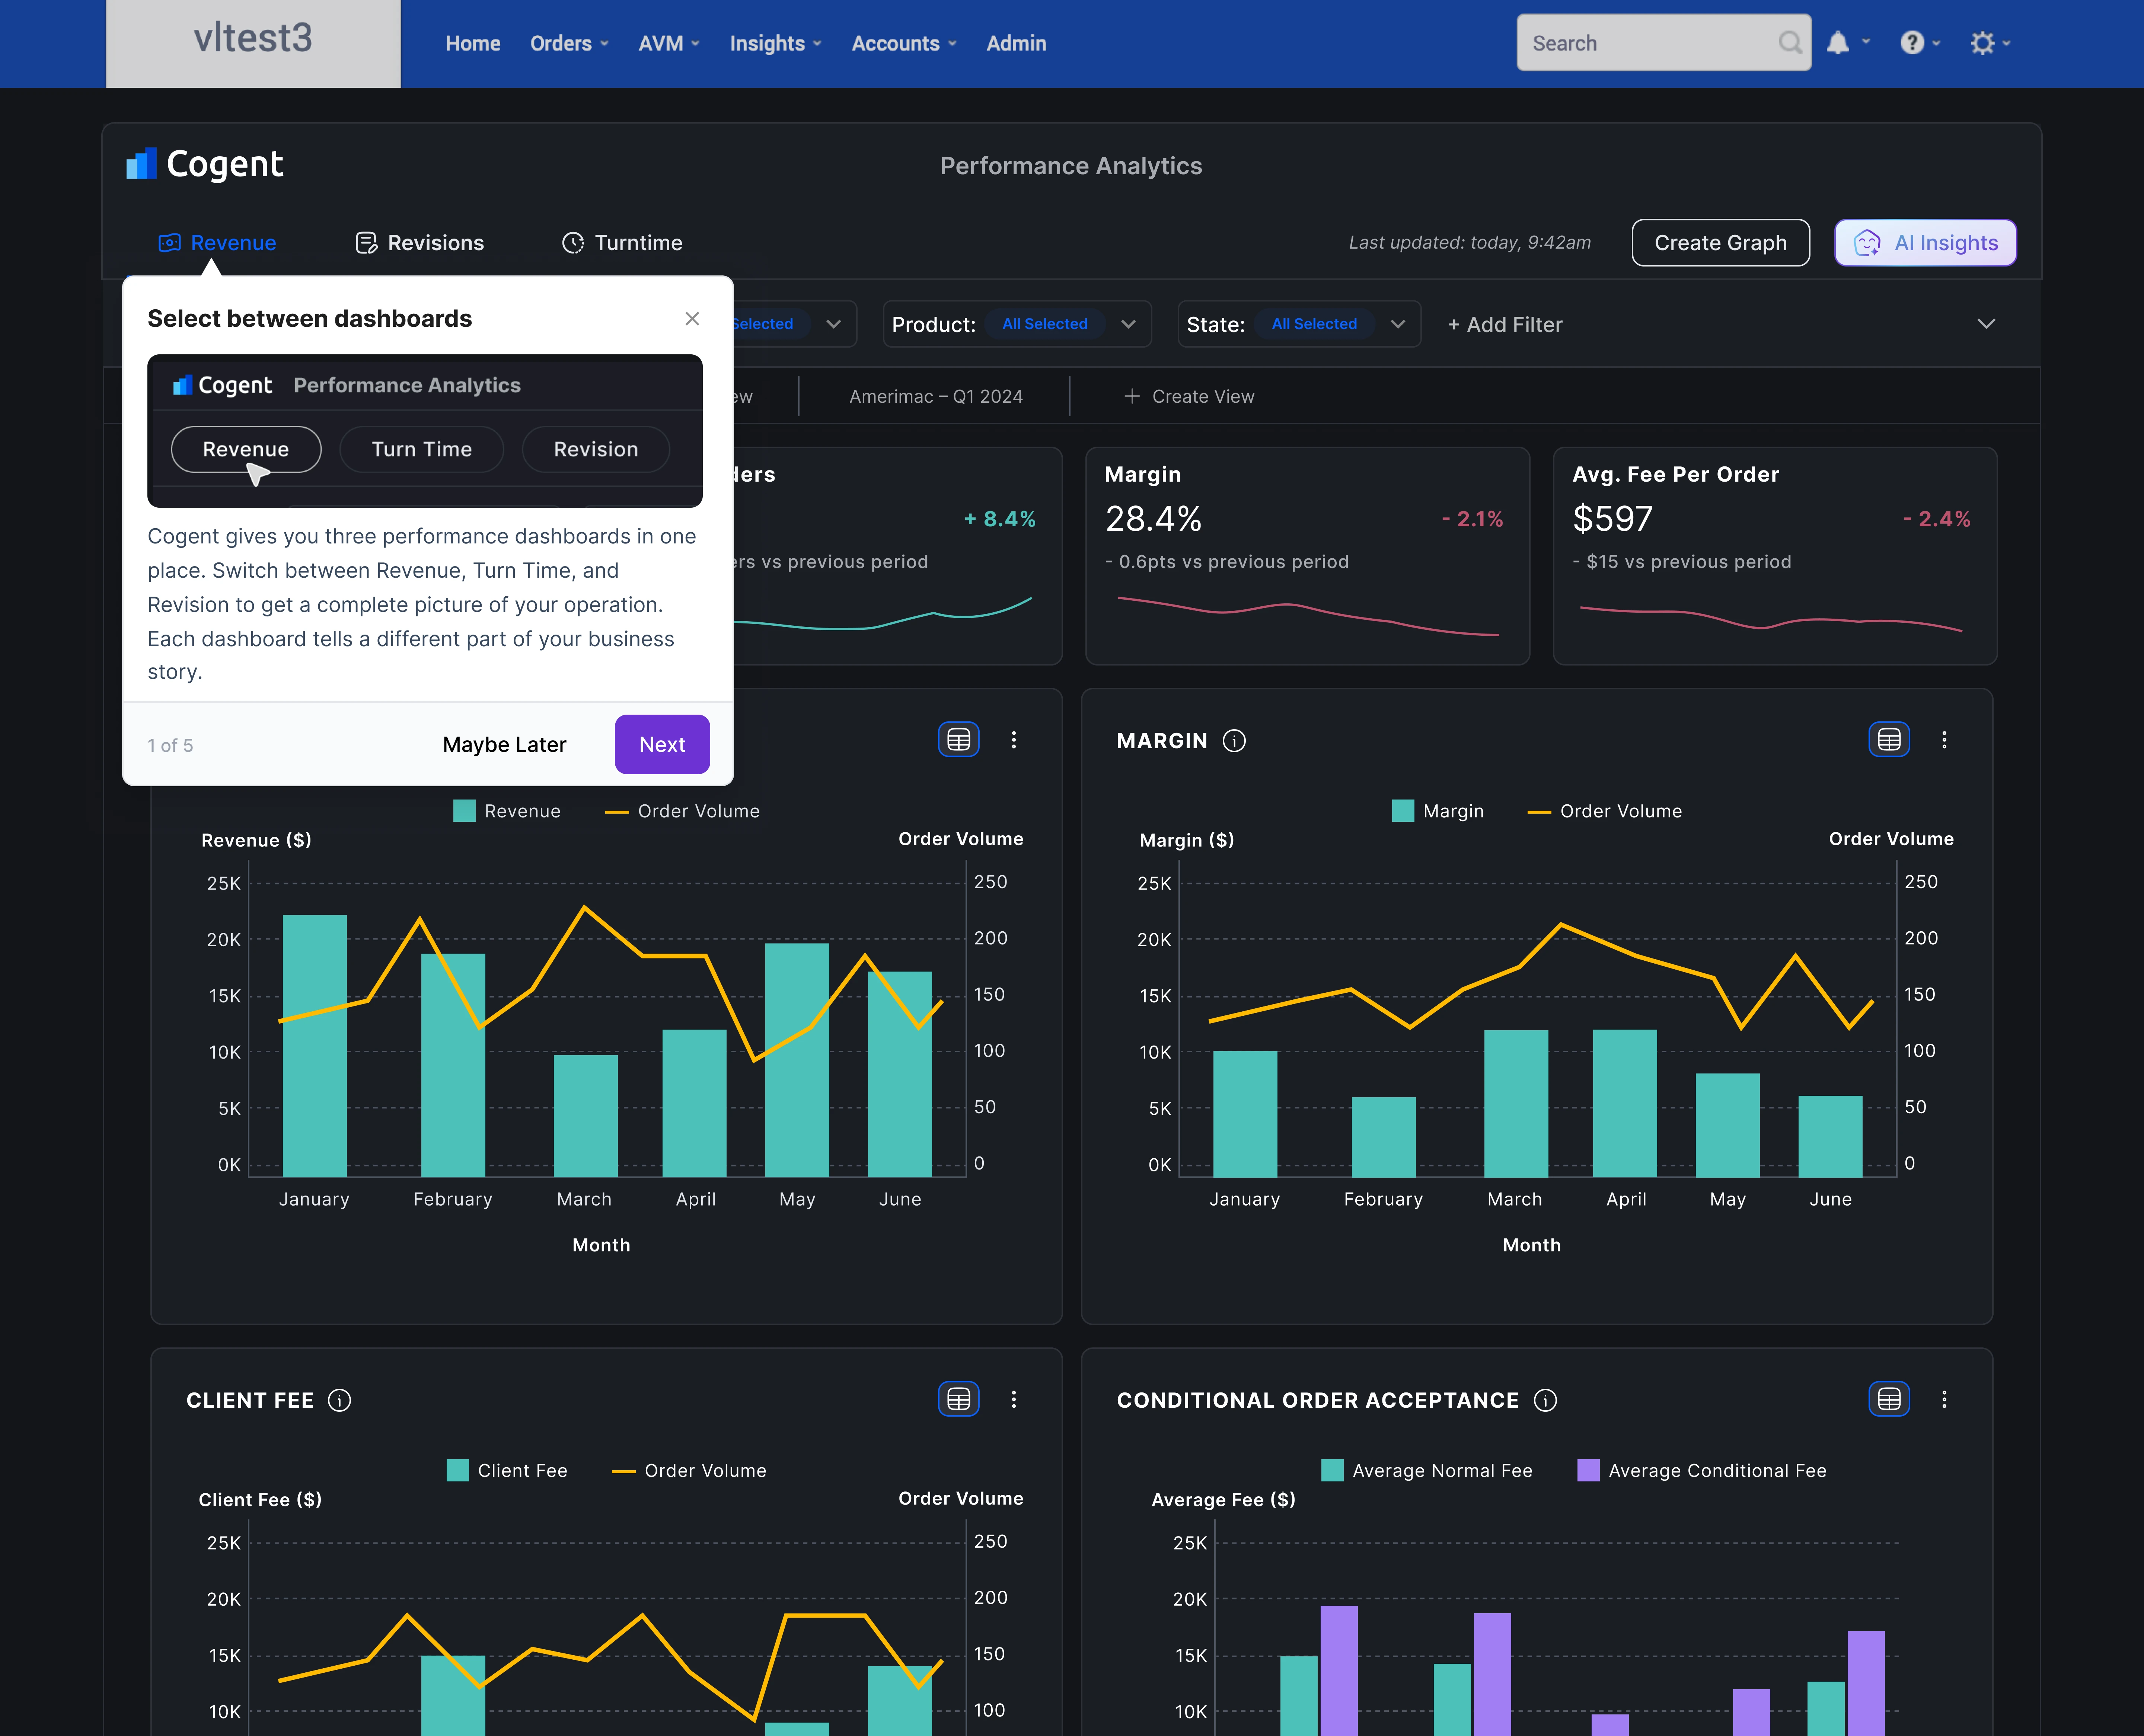
Guided Tour
Terms & conditions decline journey
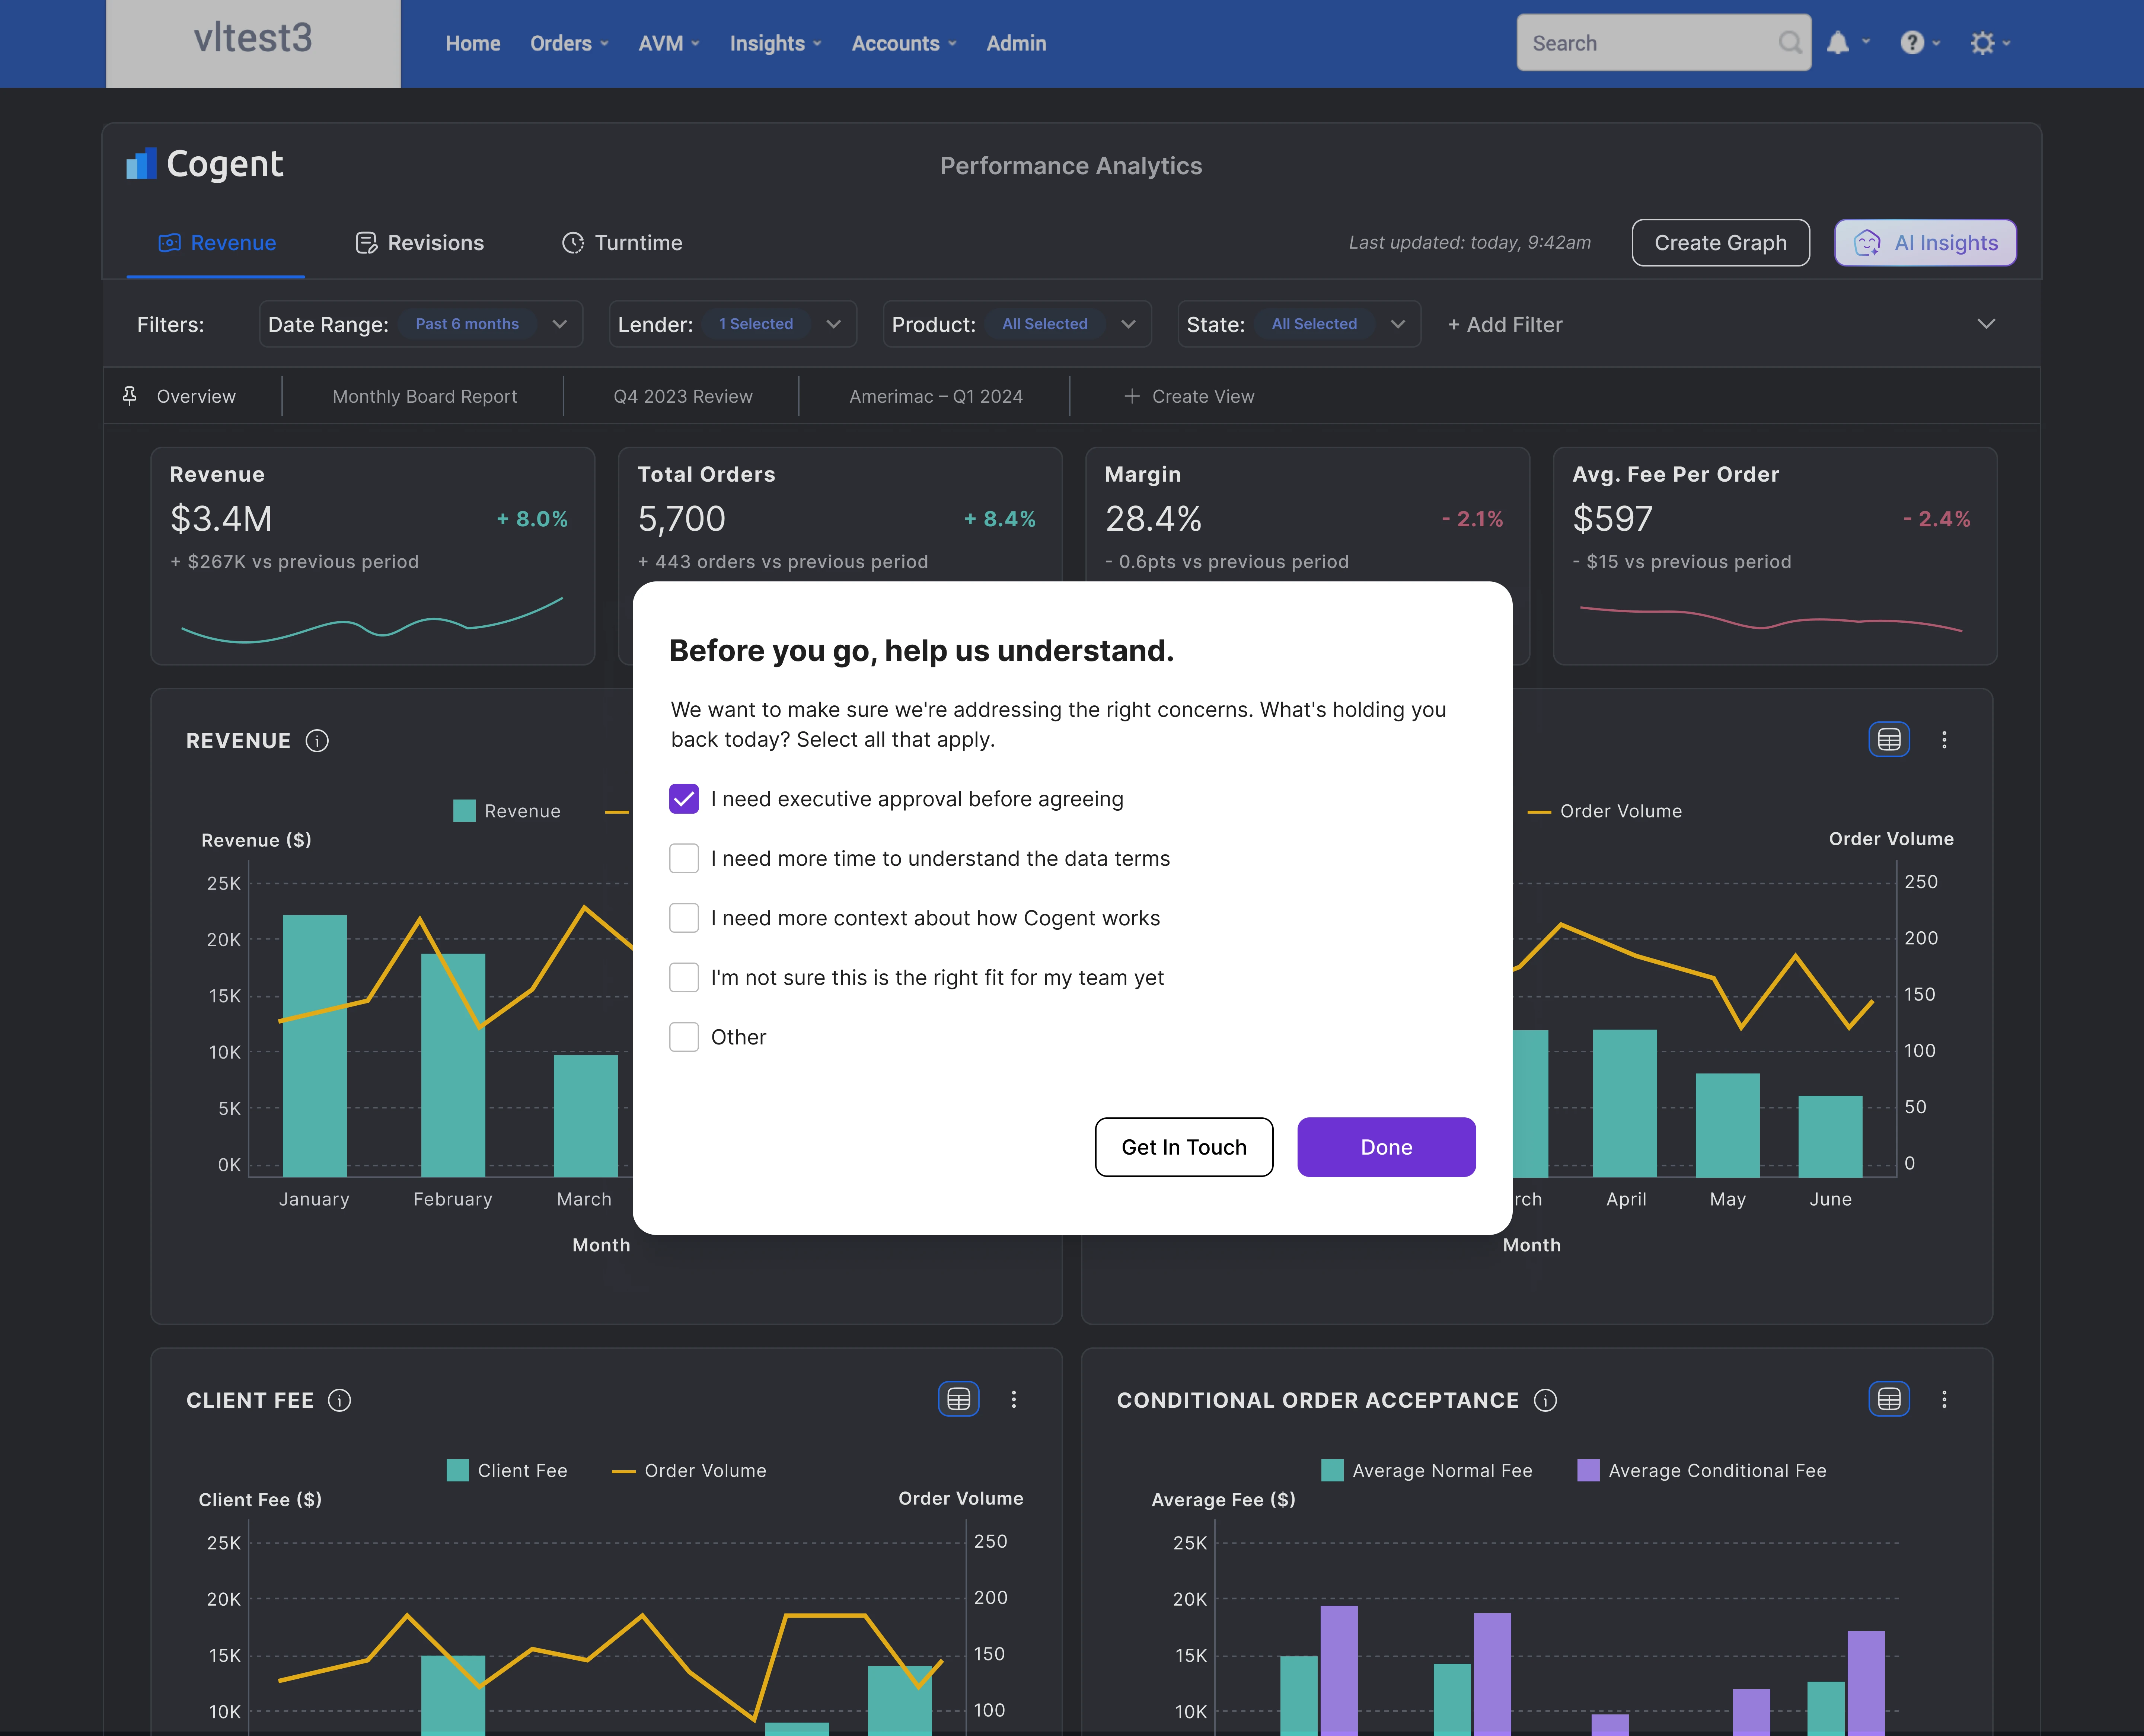
Reason for Declining
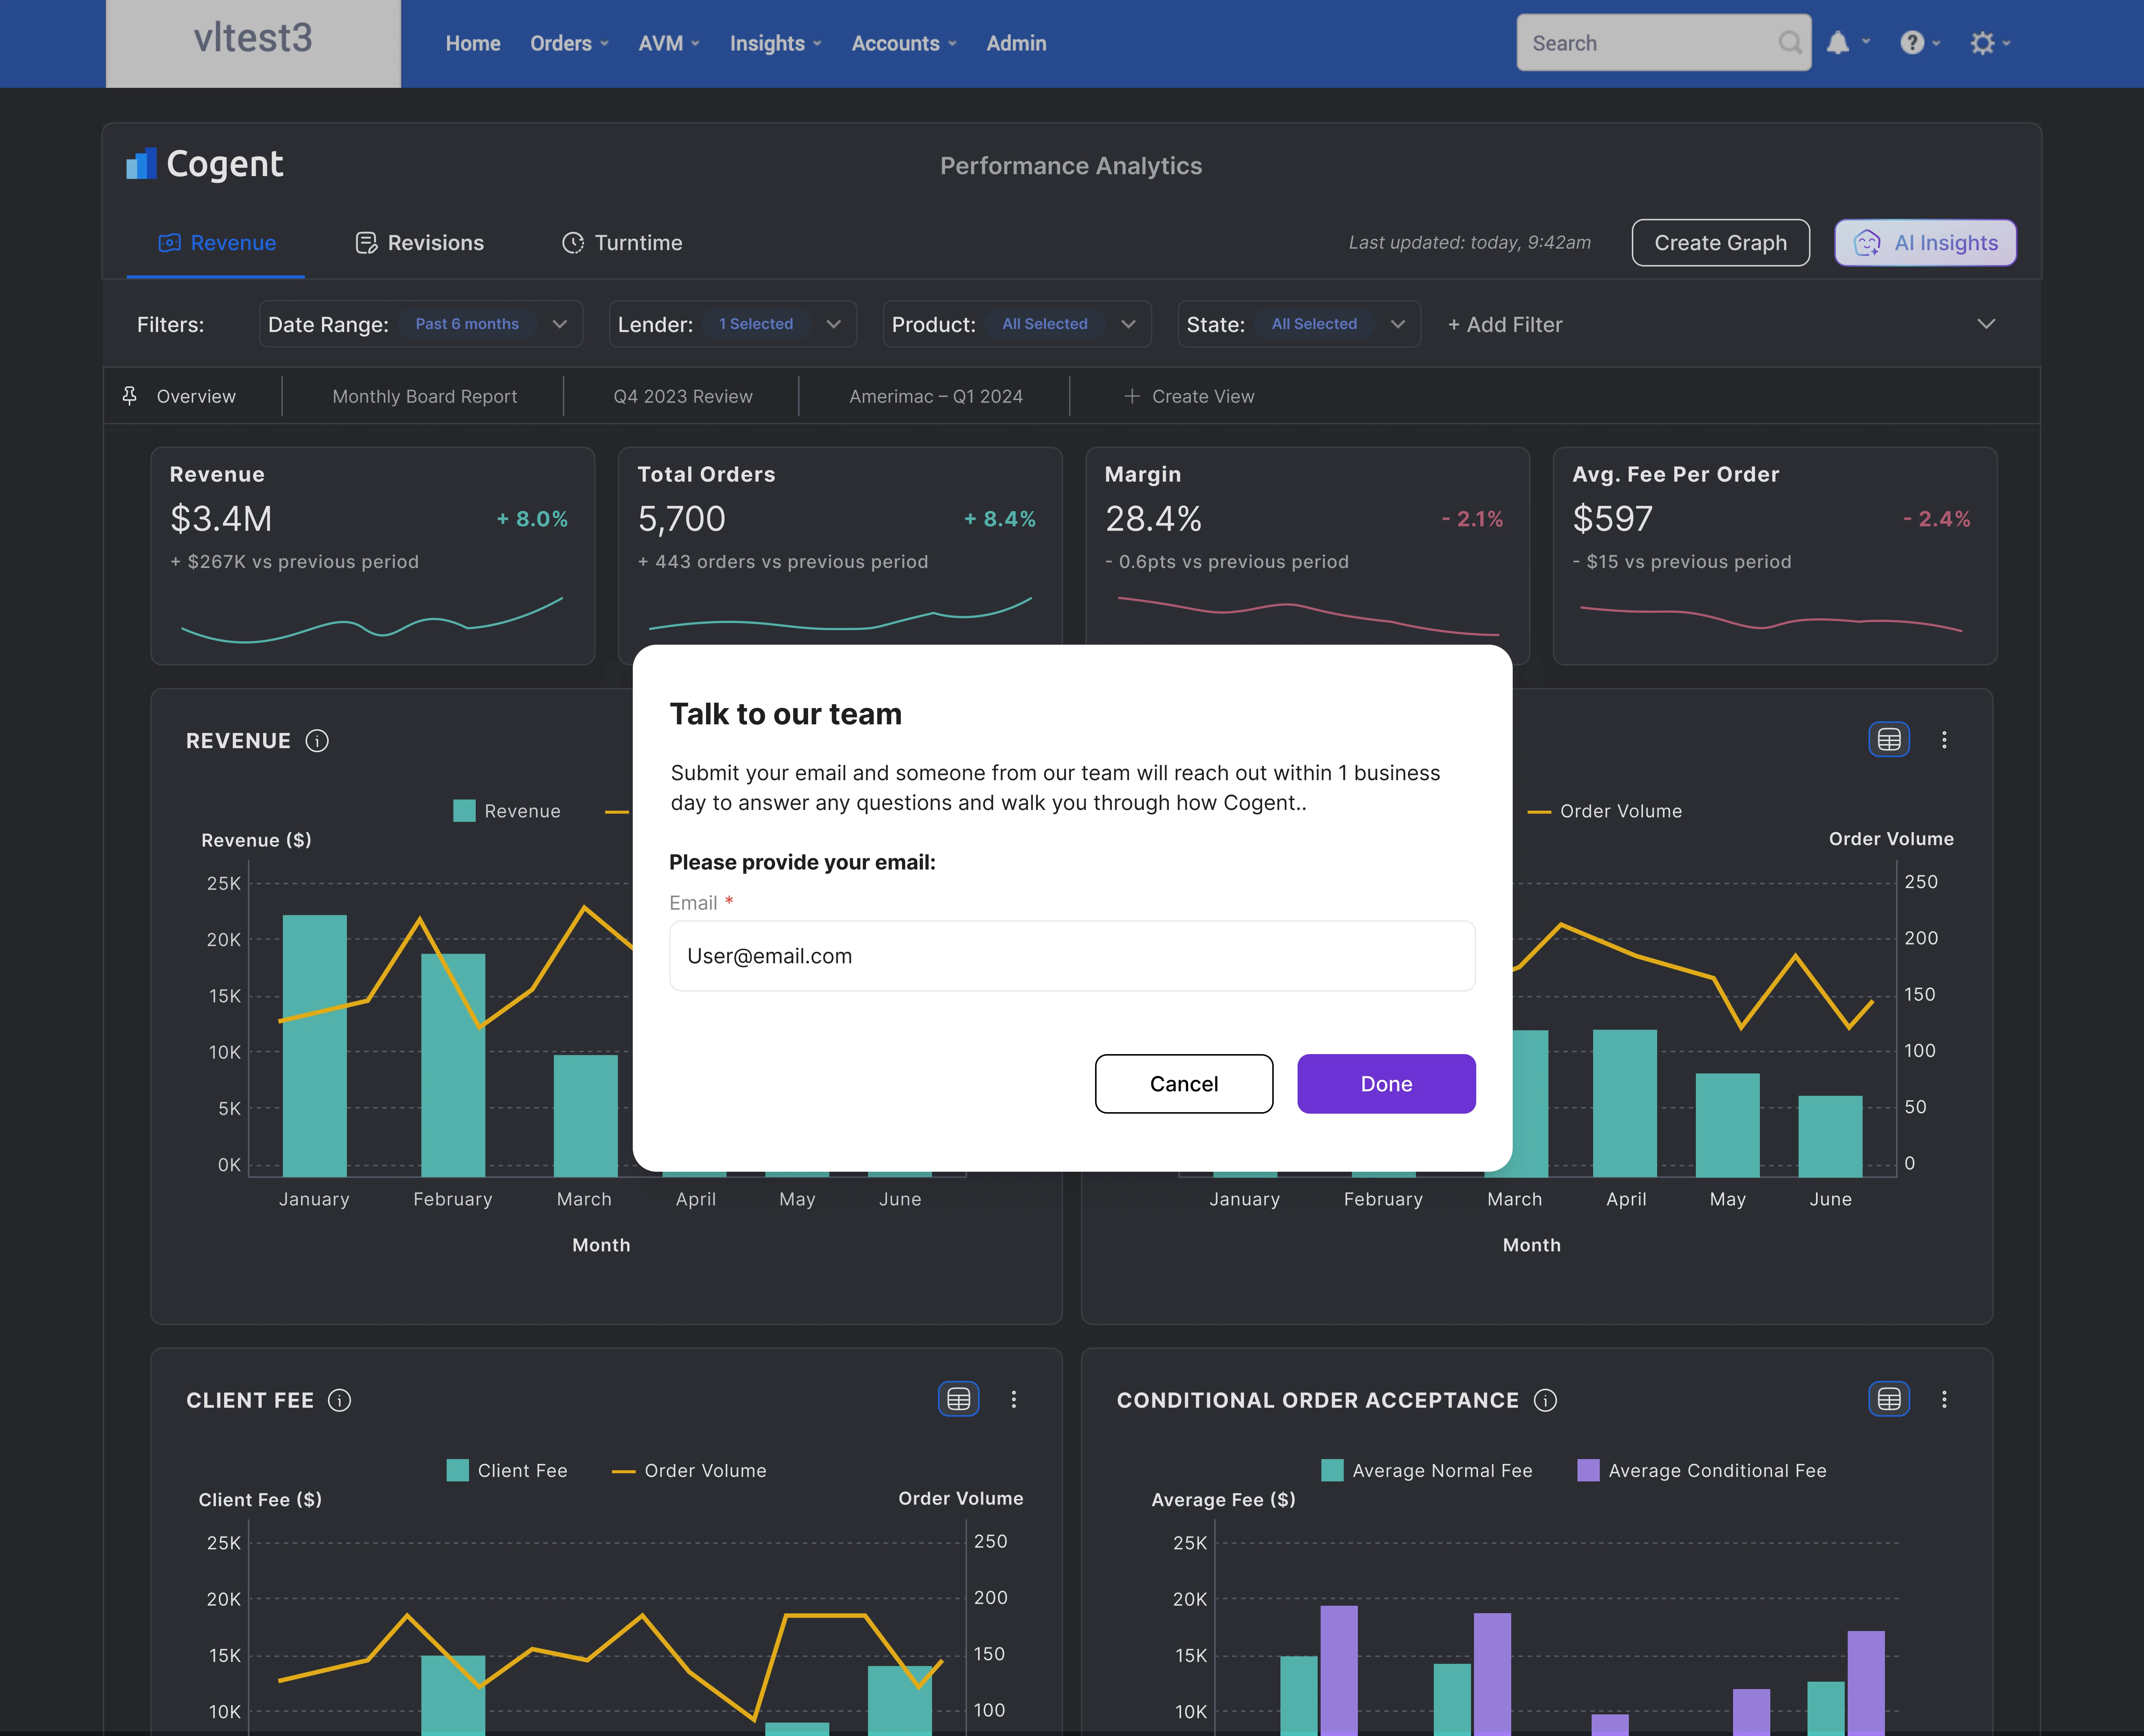
Get In Touch
Results
Results
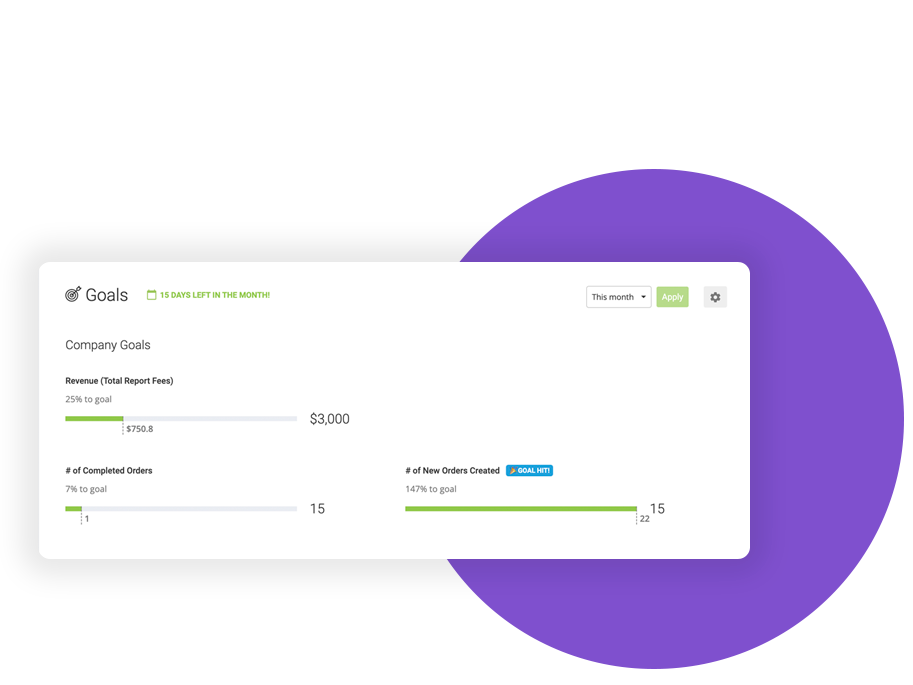
Weekly Active Usage
Achieved >46.1% weekly active usage across 200+ lenders within 2 months by leading the design of Cogent's AI-driven Revenue dashboard.
Increase in Company Revenue
Unlocked a 30.2% increase in company revenue via subscription packages for the AI feature Cogent Insights Explorer
Orders Processed
Total orders processed through Cogent
Tradeoffs
Tradeoffs and how I plan to tackle them
Why I chose a modal over a side panel
I chose a modal for the AI Insights view rather than a side panel, and the reasoning was twofold. First, we already had an AI workflow agent on the roadmap, not yet fully defined, but concrete enough that I didn't want to claim that side panel space for a different feature. Reserving it kept the door open for a global component we knew was coming. Second, the two features serve fundamentally different purposes: the agent is operational and in-flow, helping users act on their current screen. Cogent Insights is analytical and reflective. The modal reinforces that distinction. The tradeoff is that it temporarily obscures the dashboard behind it.