Valuelink Software B2B SaaS Shipped

An AI-Powered Dashboard That Turned Scattered Data Into Decisions

30.2%

Increase in Revenue

46.1%

Weekly Active Usage

200+

Lenders in 2 Months

My Role

Sole designer, zero to one

Role

Sole Product Designer

Responsibilities

Design feature from 0 → 1

Collaborators

1 Product Manager, 1 Product Designer (Me), Backend Engineers, QA

Timeline

2025

Business Goals

Grow revenue by 30%.

Enable measurable weekly active usage.

Users

AMCs sit between the lender and the appraiser

A lender orders an appraisal. The AMC assigns it to an appraiser from their panel, tracks it through review for quality and compliance, and delivers the report back before the lender's deadline.

Order goes out

Report comes back

The Problem

Dashboards, disconnected

AMCs had to analyze their own performance daily, but the numbers lived across scattered dashboards with no single source of truth. Most people never dug past the headline stat, so metrics moved with no visible cause, insights weren't actionable, and real opportunities went uncaught.

Research

Turning user pain points into validated product metrics

I led stakeholder workshops and interviews with AMC users to identify pain points, define the metrics that mattered, and prioritize what to build. These points surfaced:

User behavior

  • Jumped between dashboards
  • Rarely explored trends beyond top-level stats
  • Took notes manually

User pain points

  • Data was overwhelming and hard to interpret
  • Insights weren't actionable, and users didn't know what to do next
  • Users lacked the confidence to make data-driven decisions

Research

A profile for every role

Each role got its own profile: user description, workflow, behavioral traits, motivations and success criteria, and pain points, grounded in real conversations with named stakeholders at AMCs like Equity Solutions, Ascribe, CMG, NAF, and Flagstar.
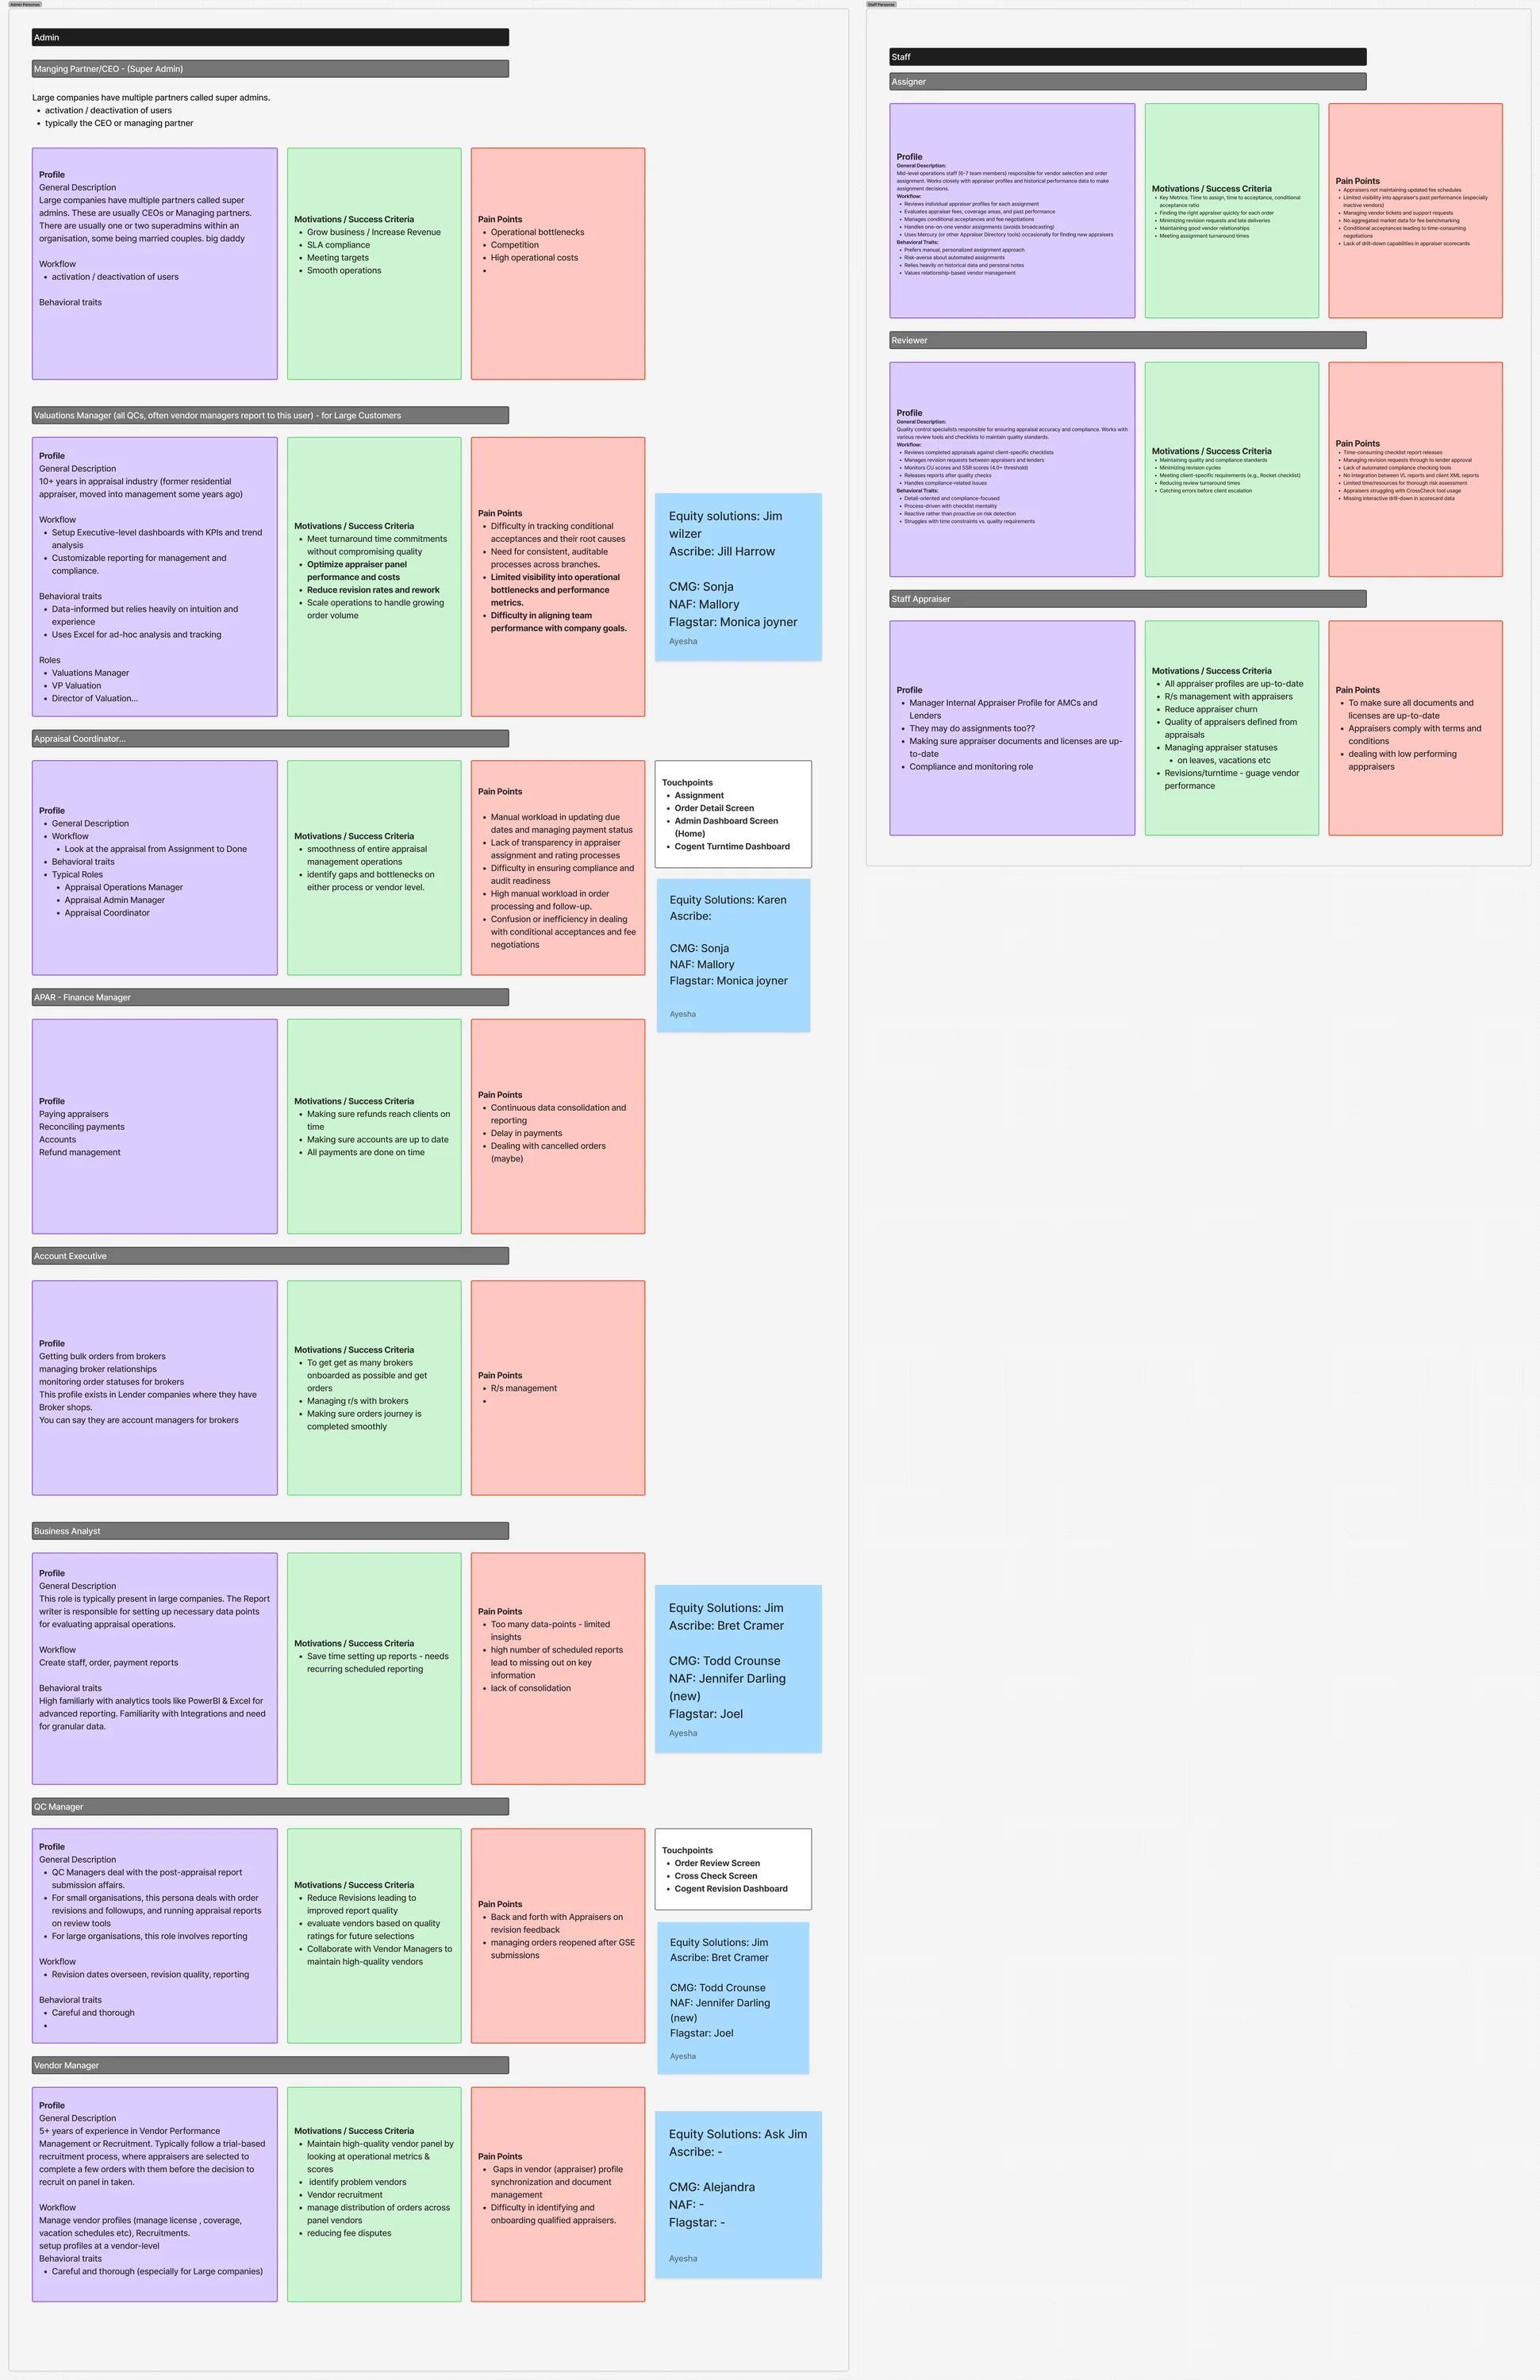
User pain points and motivations mapped per AMC role

The Reframe

Not a data problem. A clarity problem.

AMCs weren't missing data. They were drowning in it, scattered across screens, with no path from a number to a next action. The opportunity wasn't more data. It was the right data, consolidated, pointing at what to do next.

Research

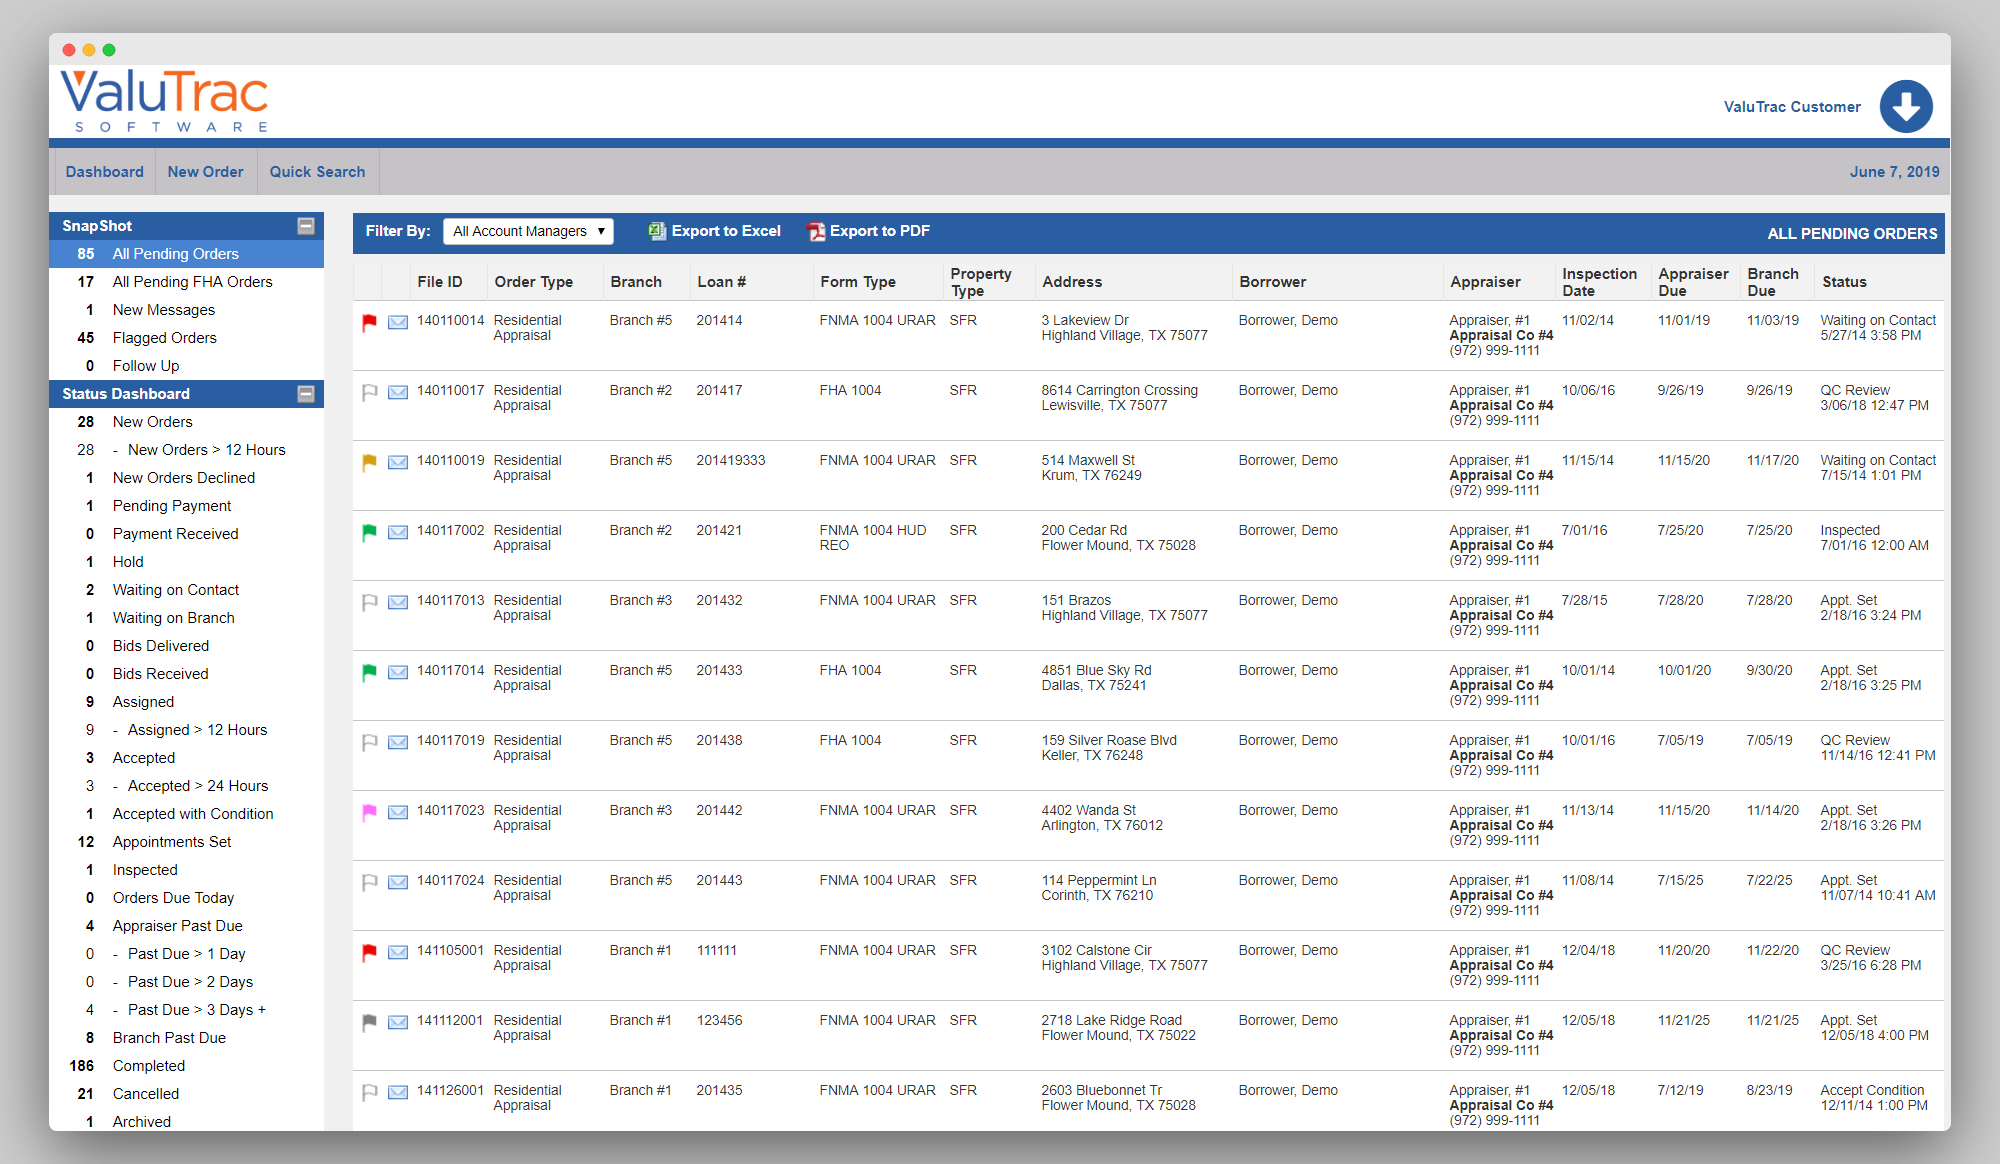
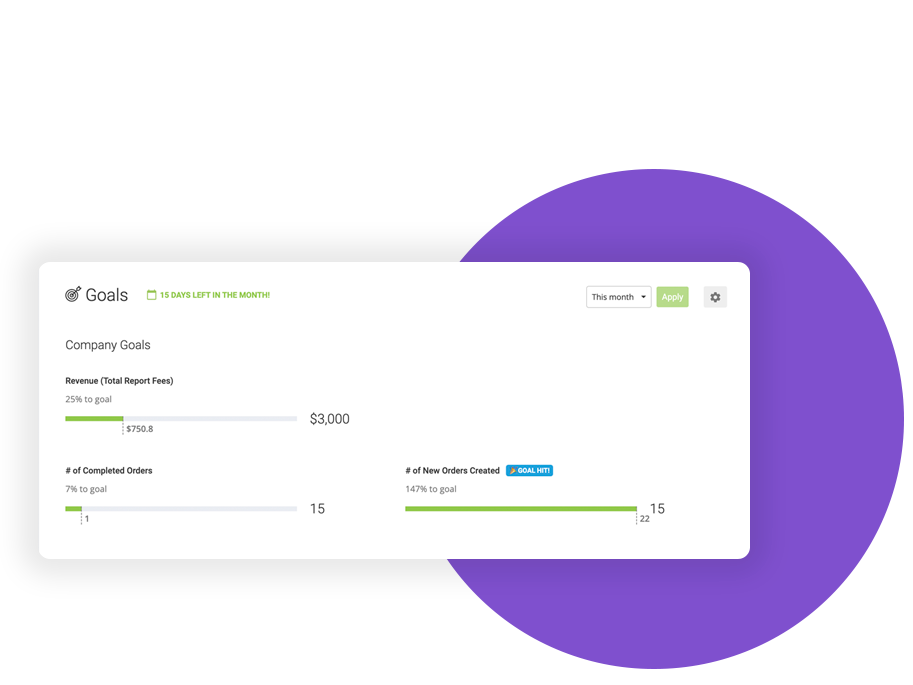
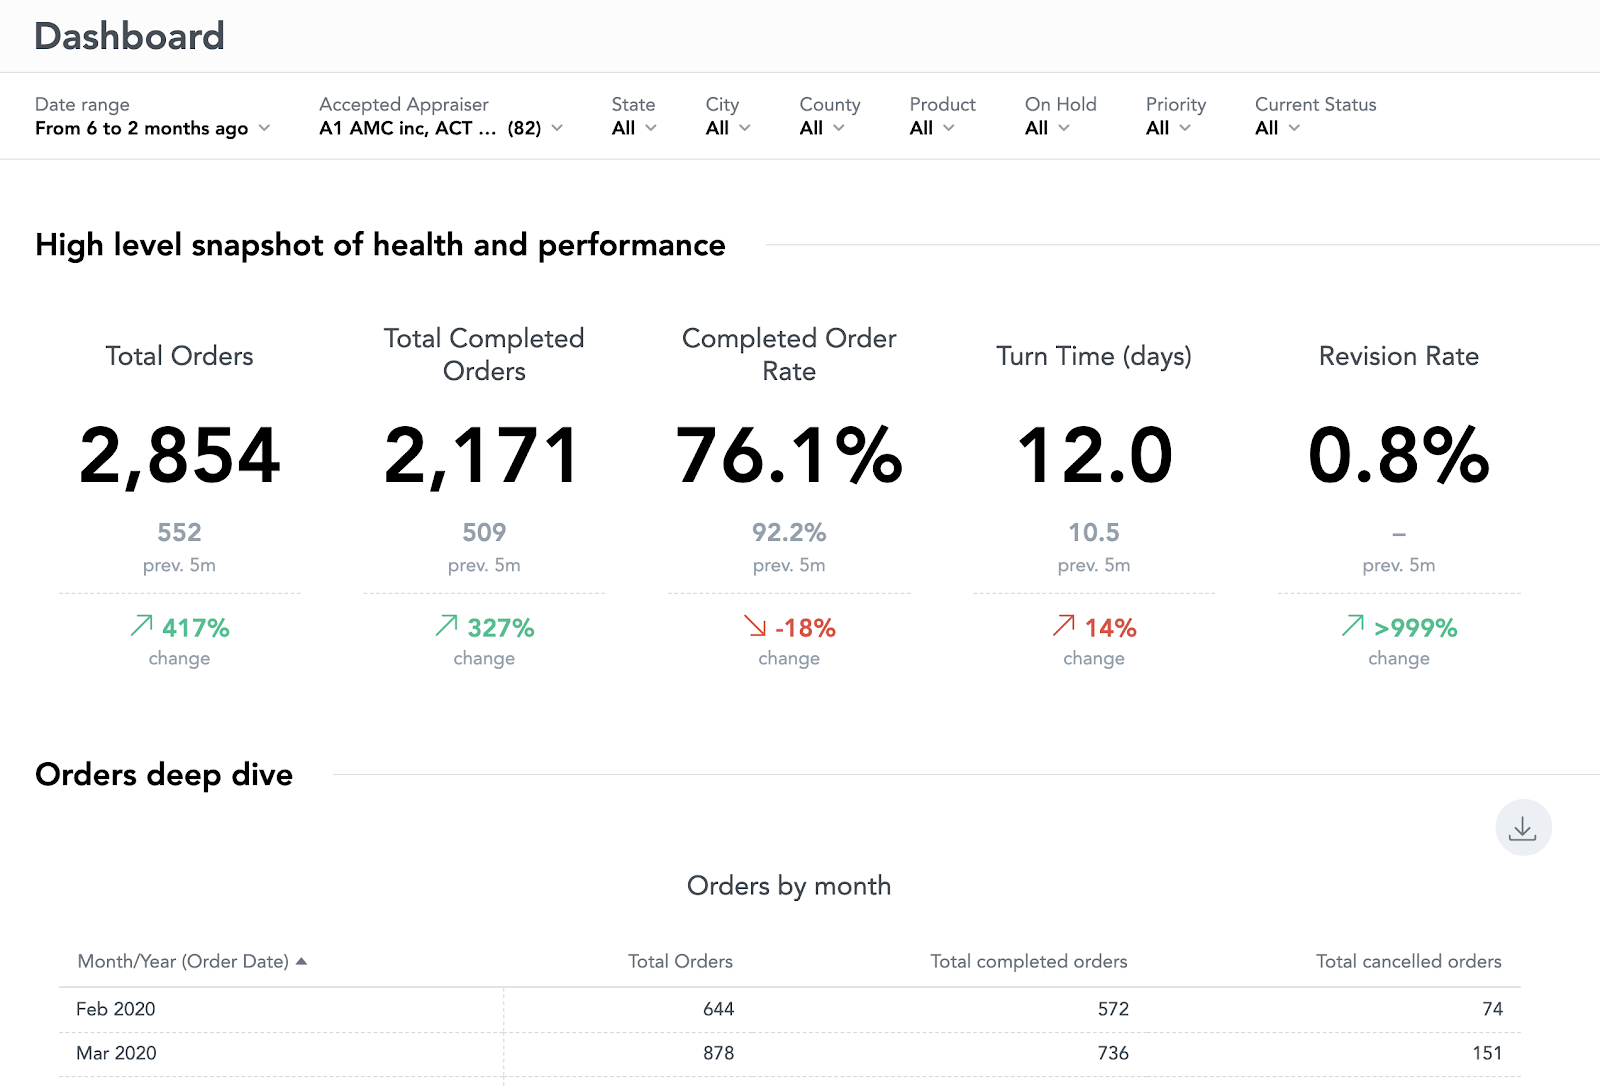
Competitive analysis: none of them answered "why," or "what do I do about it?"

Process performance, rule-based operations, workflow visibility: real, but none of it explained why a metric moved, and none of it was predictive or actionable.

Reggora dashboard

Reggora

ValuTrac dashboard

ValuTrac

Anow dashboard

Anow

Rejected Direction

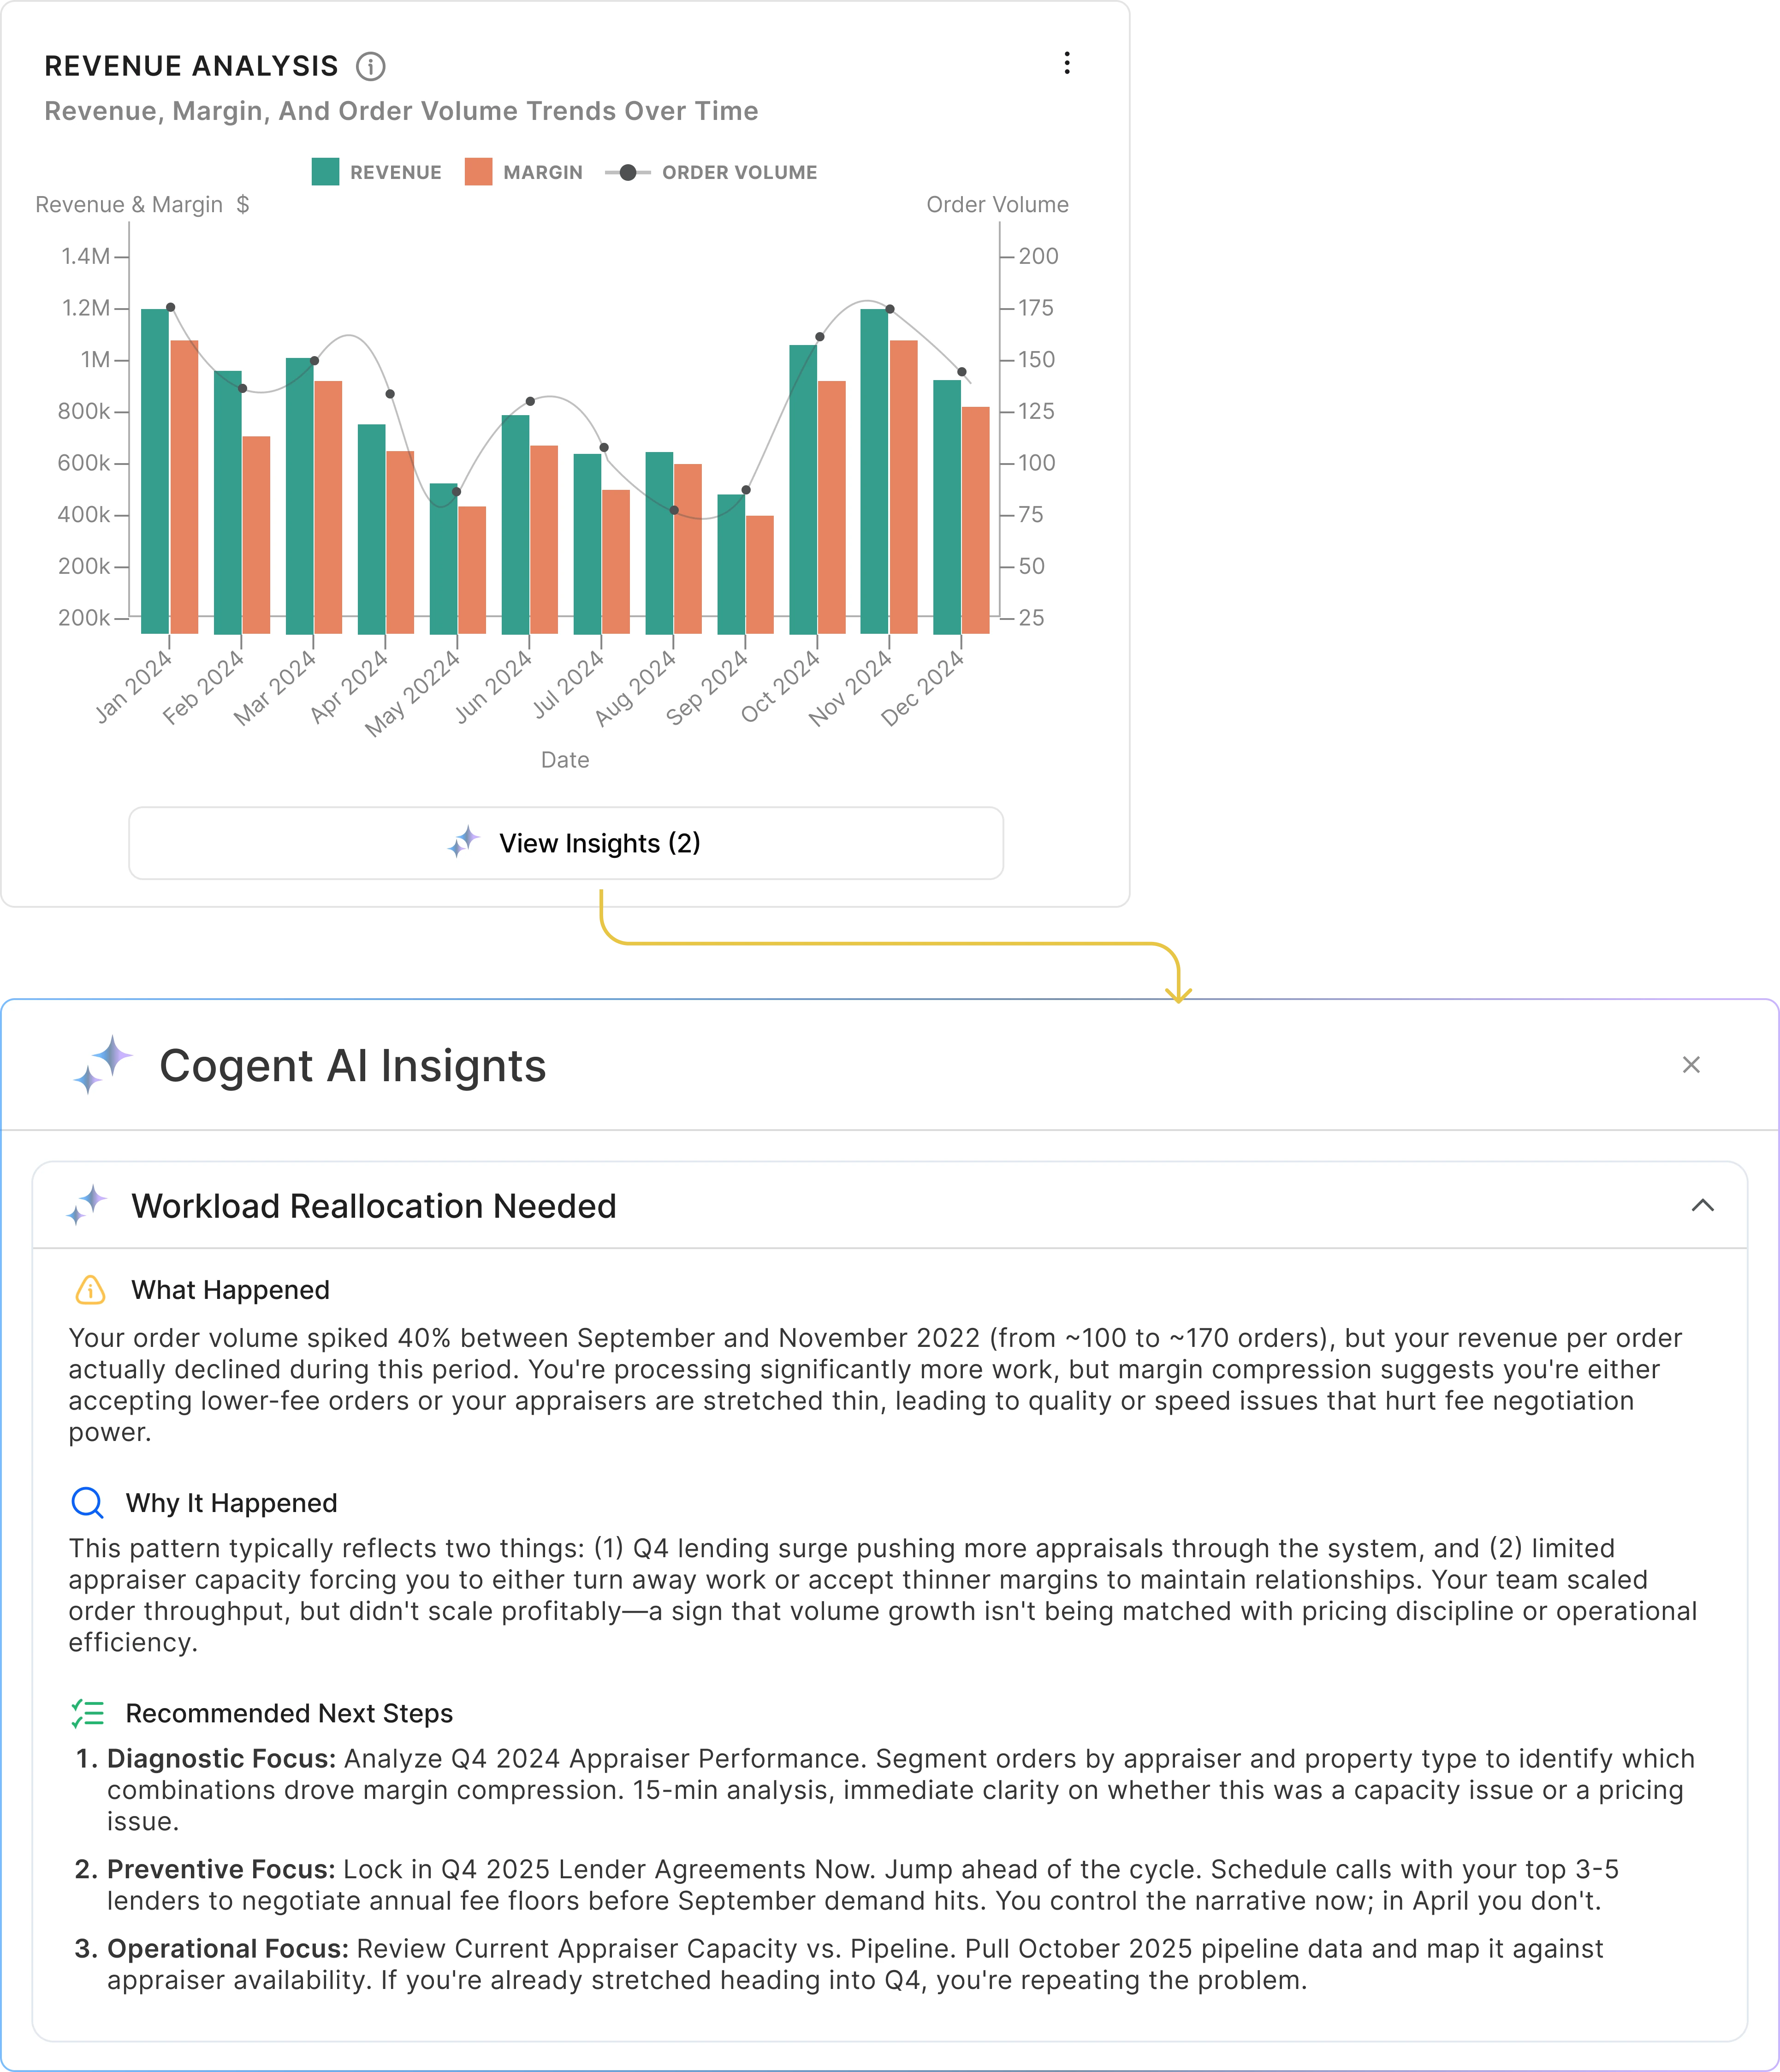
Insights hidden behind a blind click

Rejected design: insights hidden behind a View Insights button, dense multi-metric chart

Rejected Direction

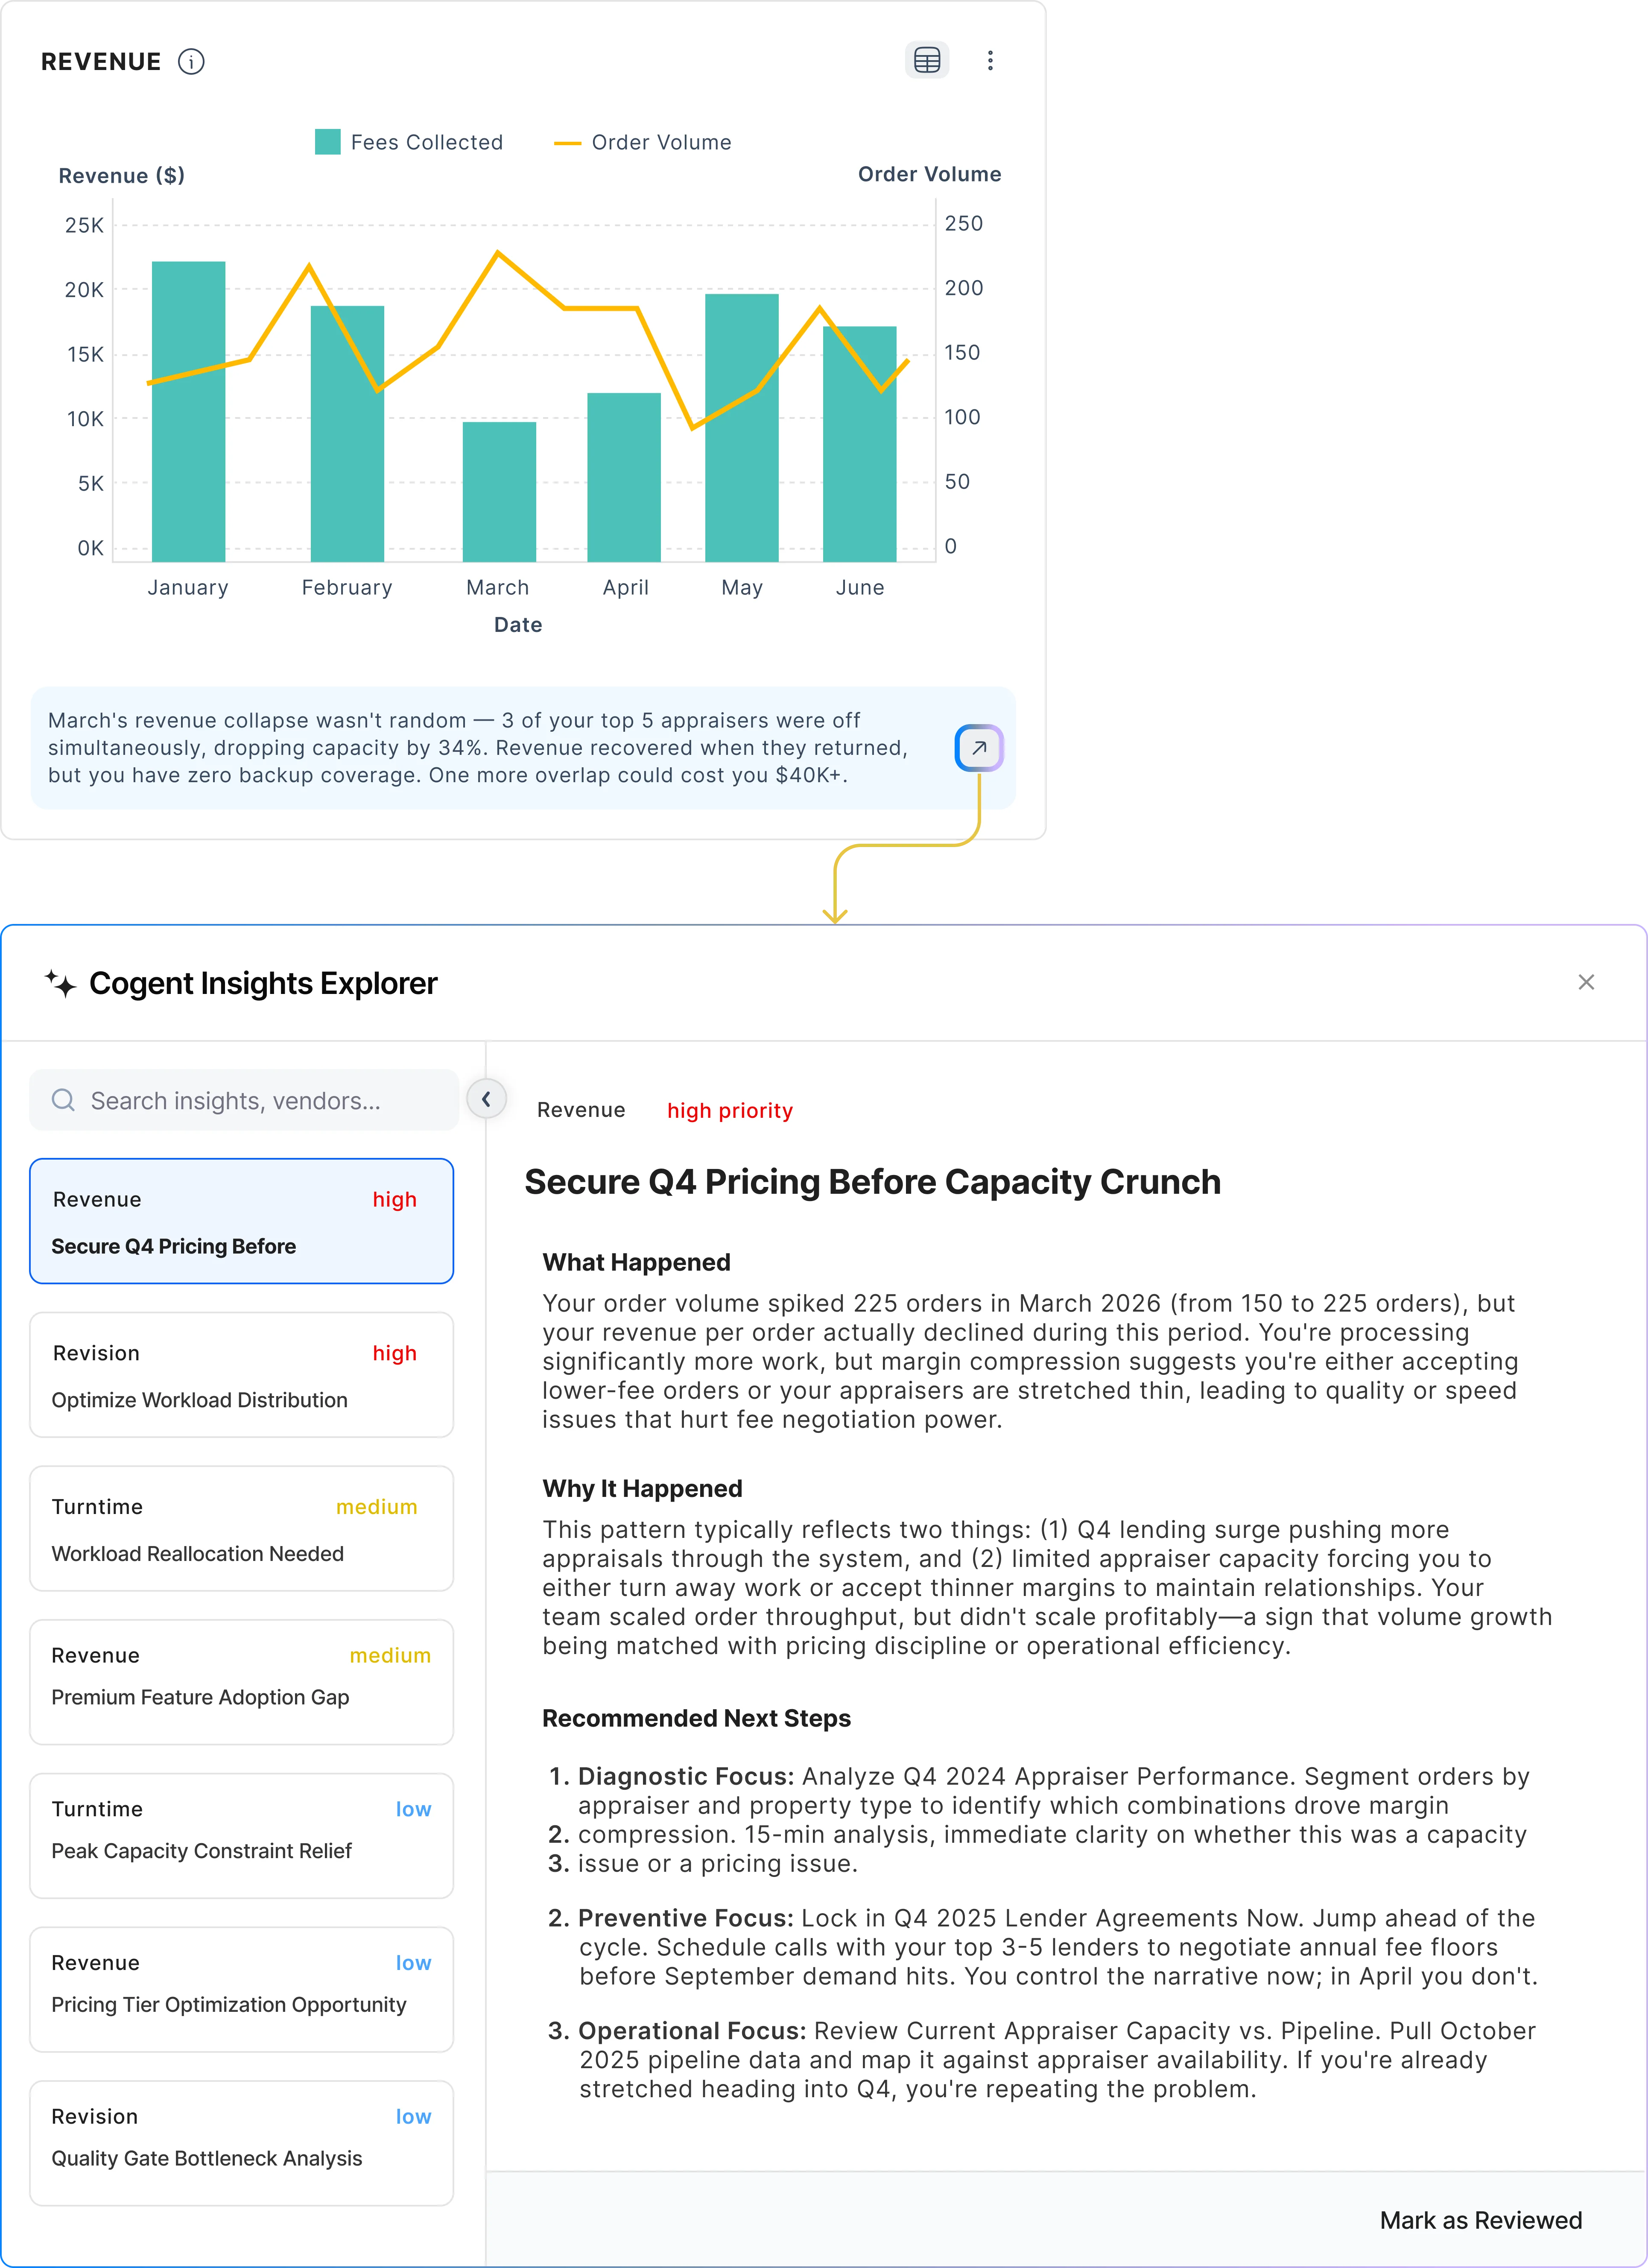
A preview that couldn't scale

Rejected design: static insight preview under the chart, Cogent Insights Explorer panel

Final Designs

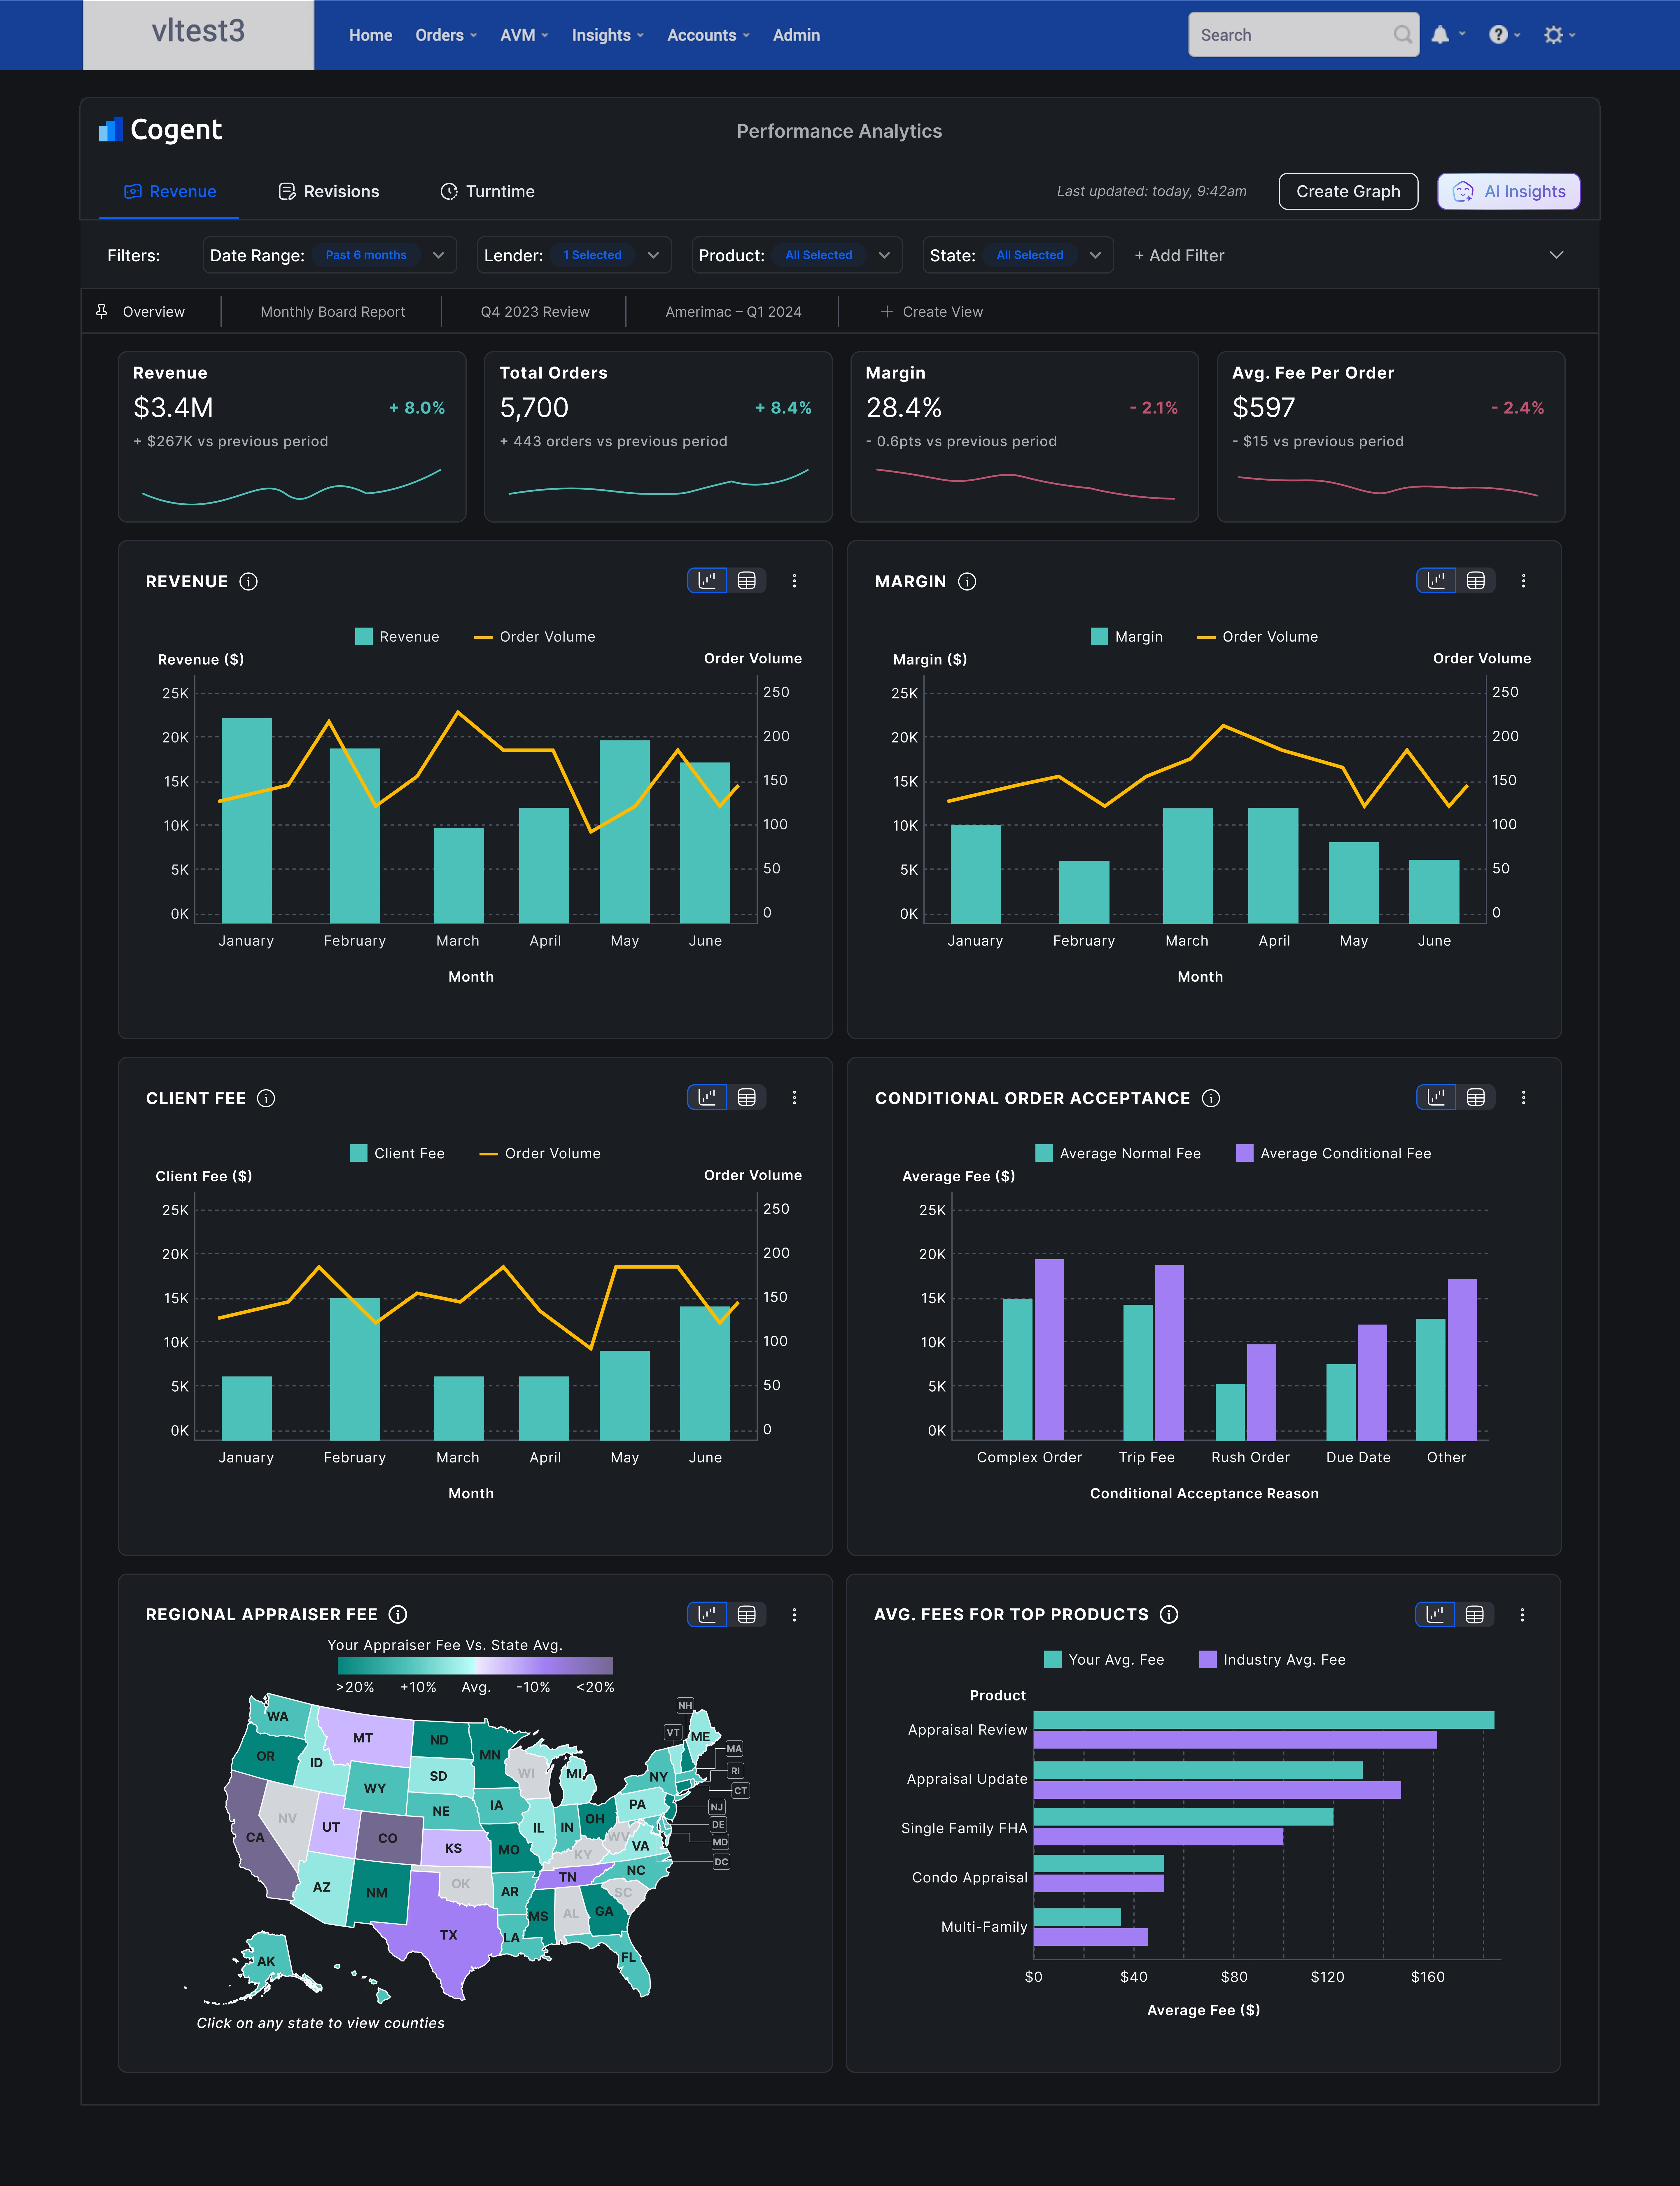
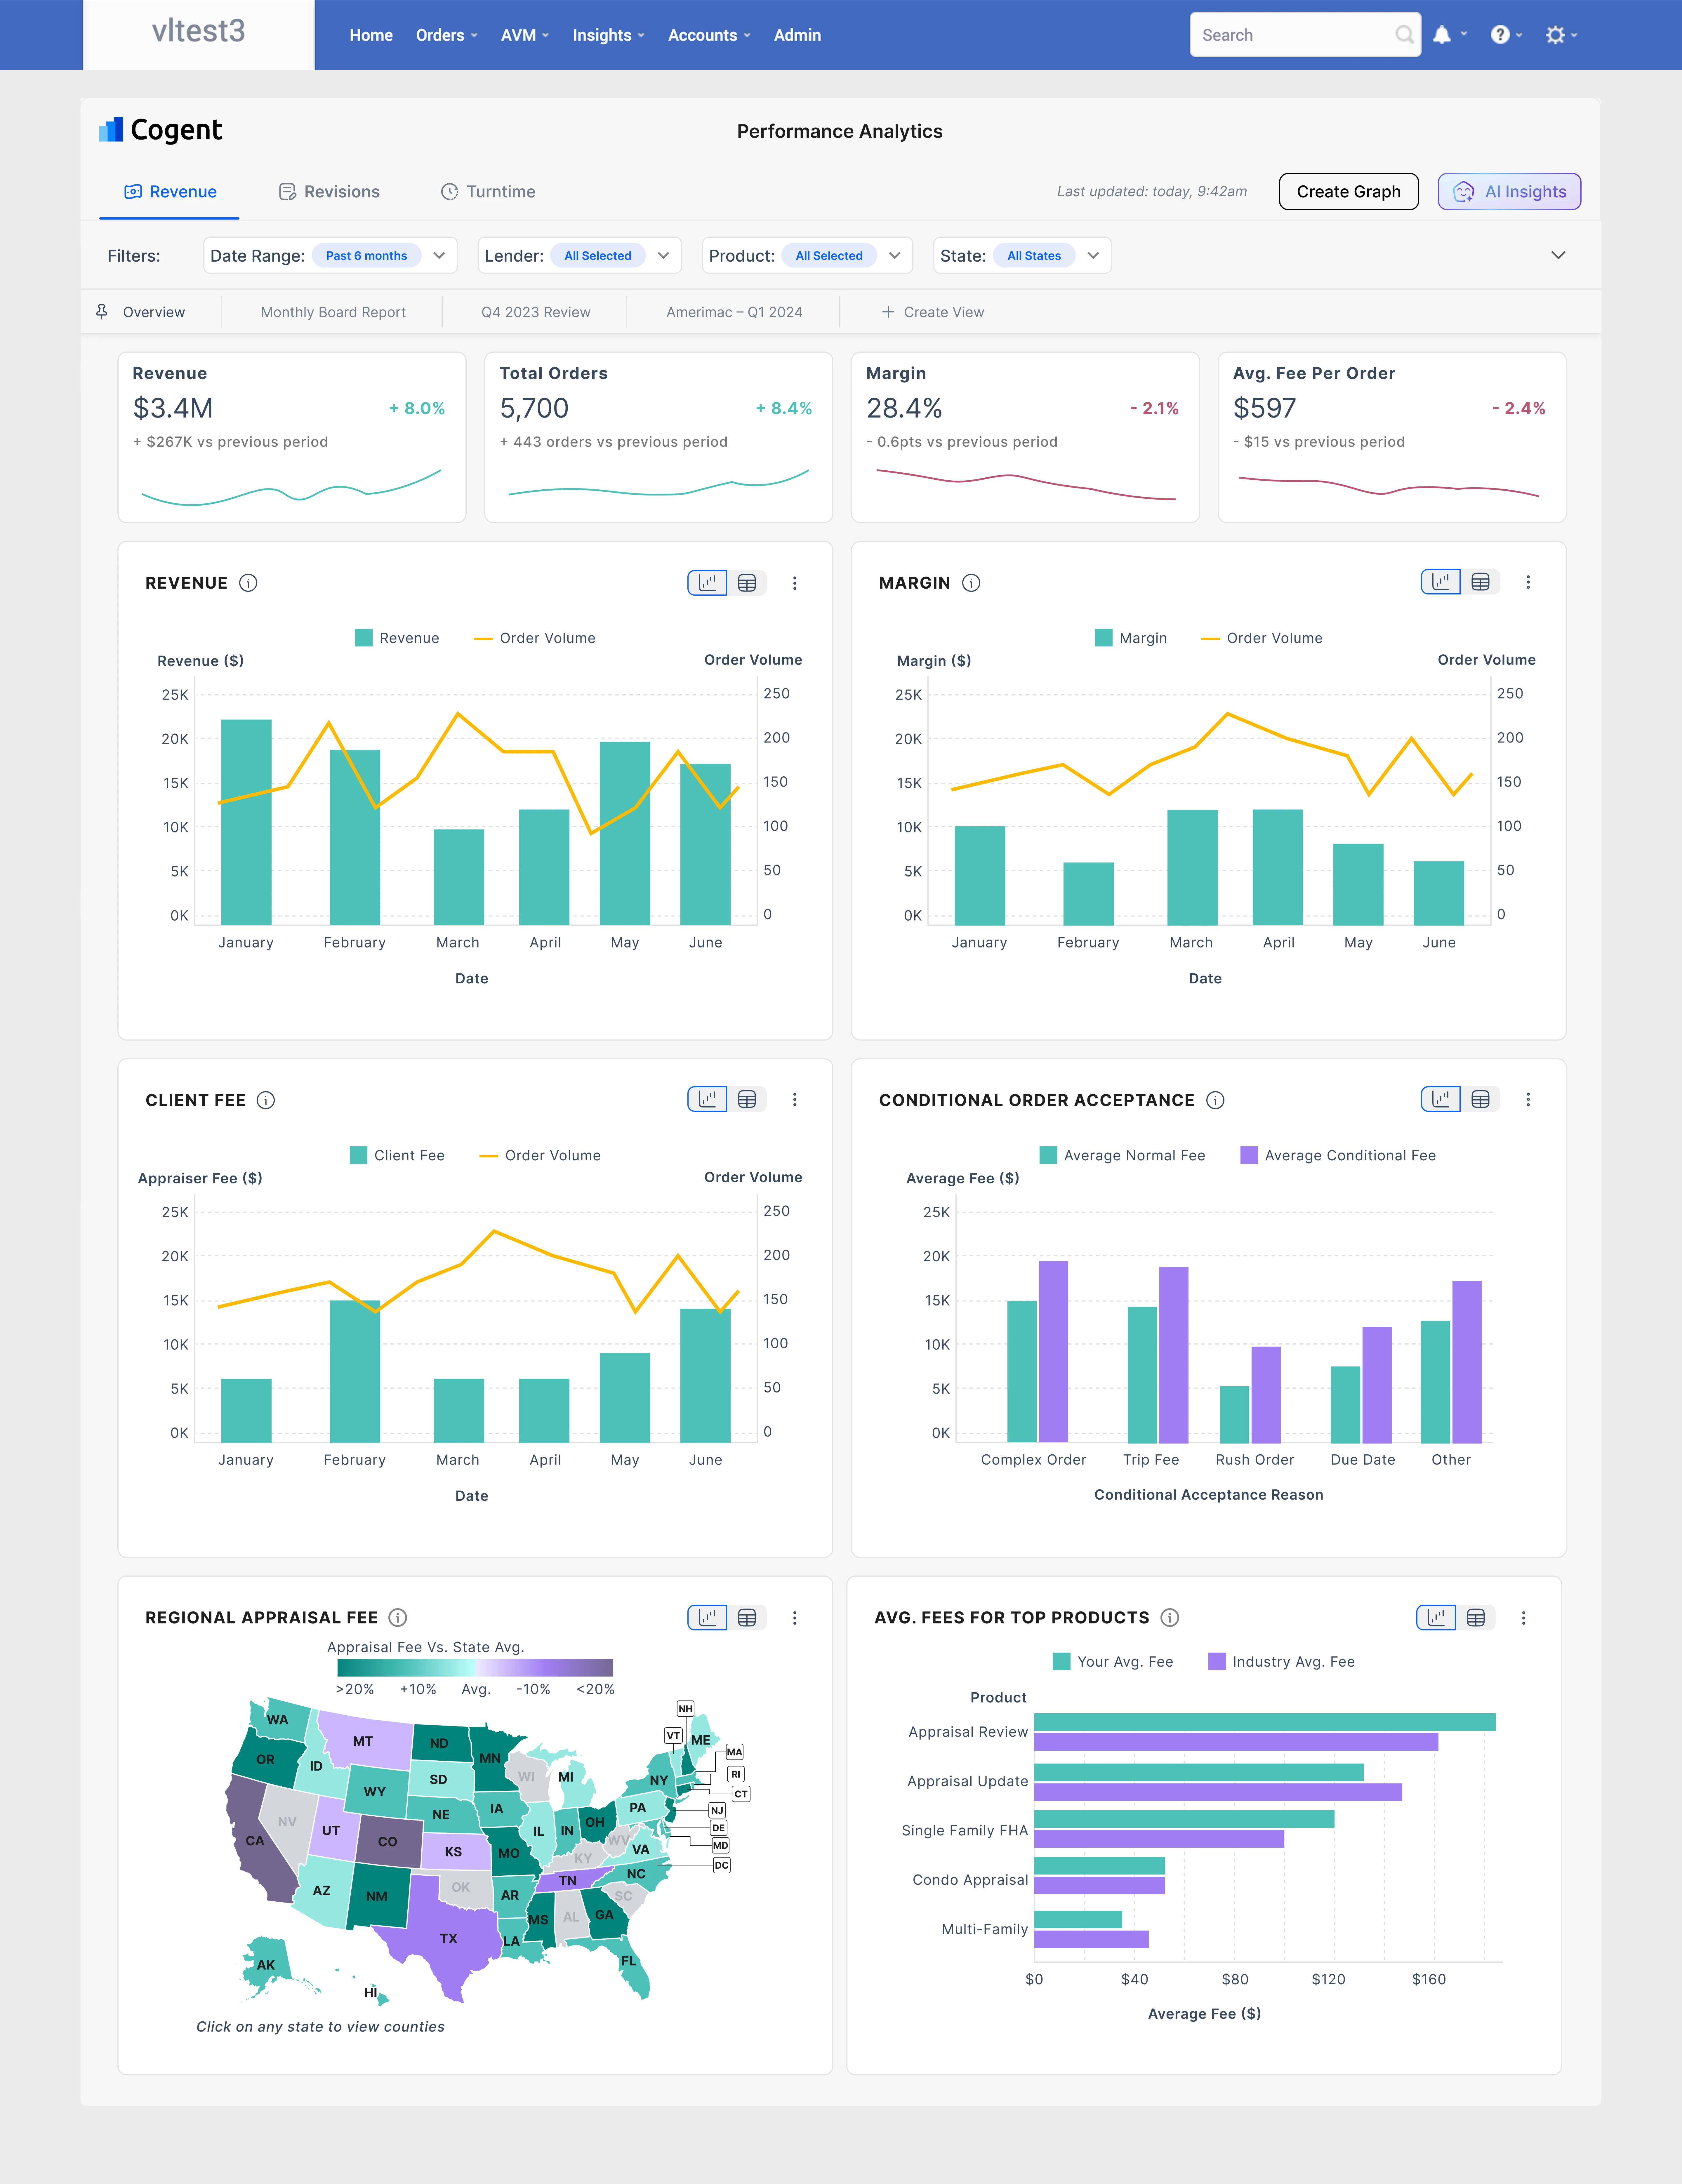
Dark mode and light mode

Final design in dark mode

Dark Mode

Final design in light mode

Light Mode

Final Designs

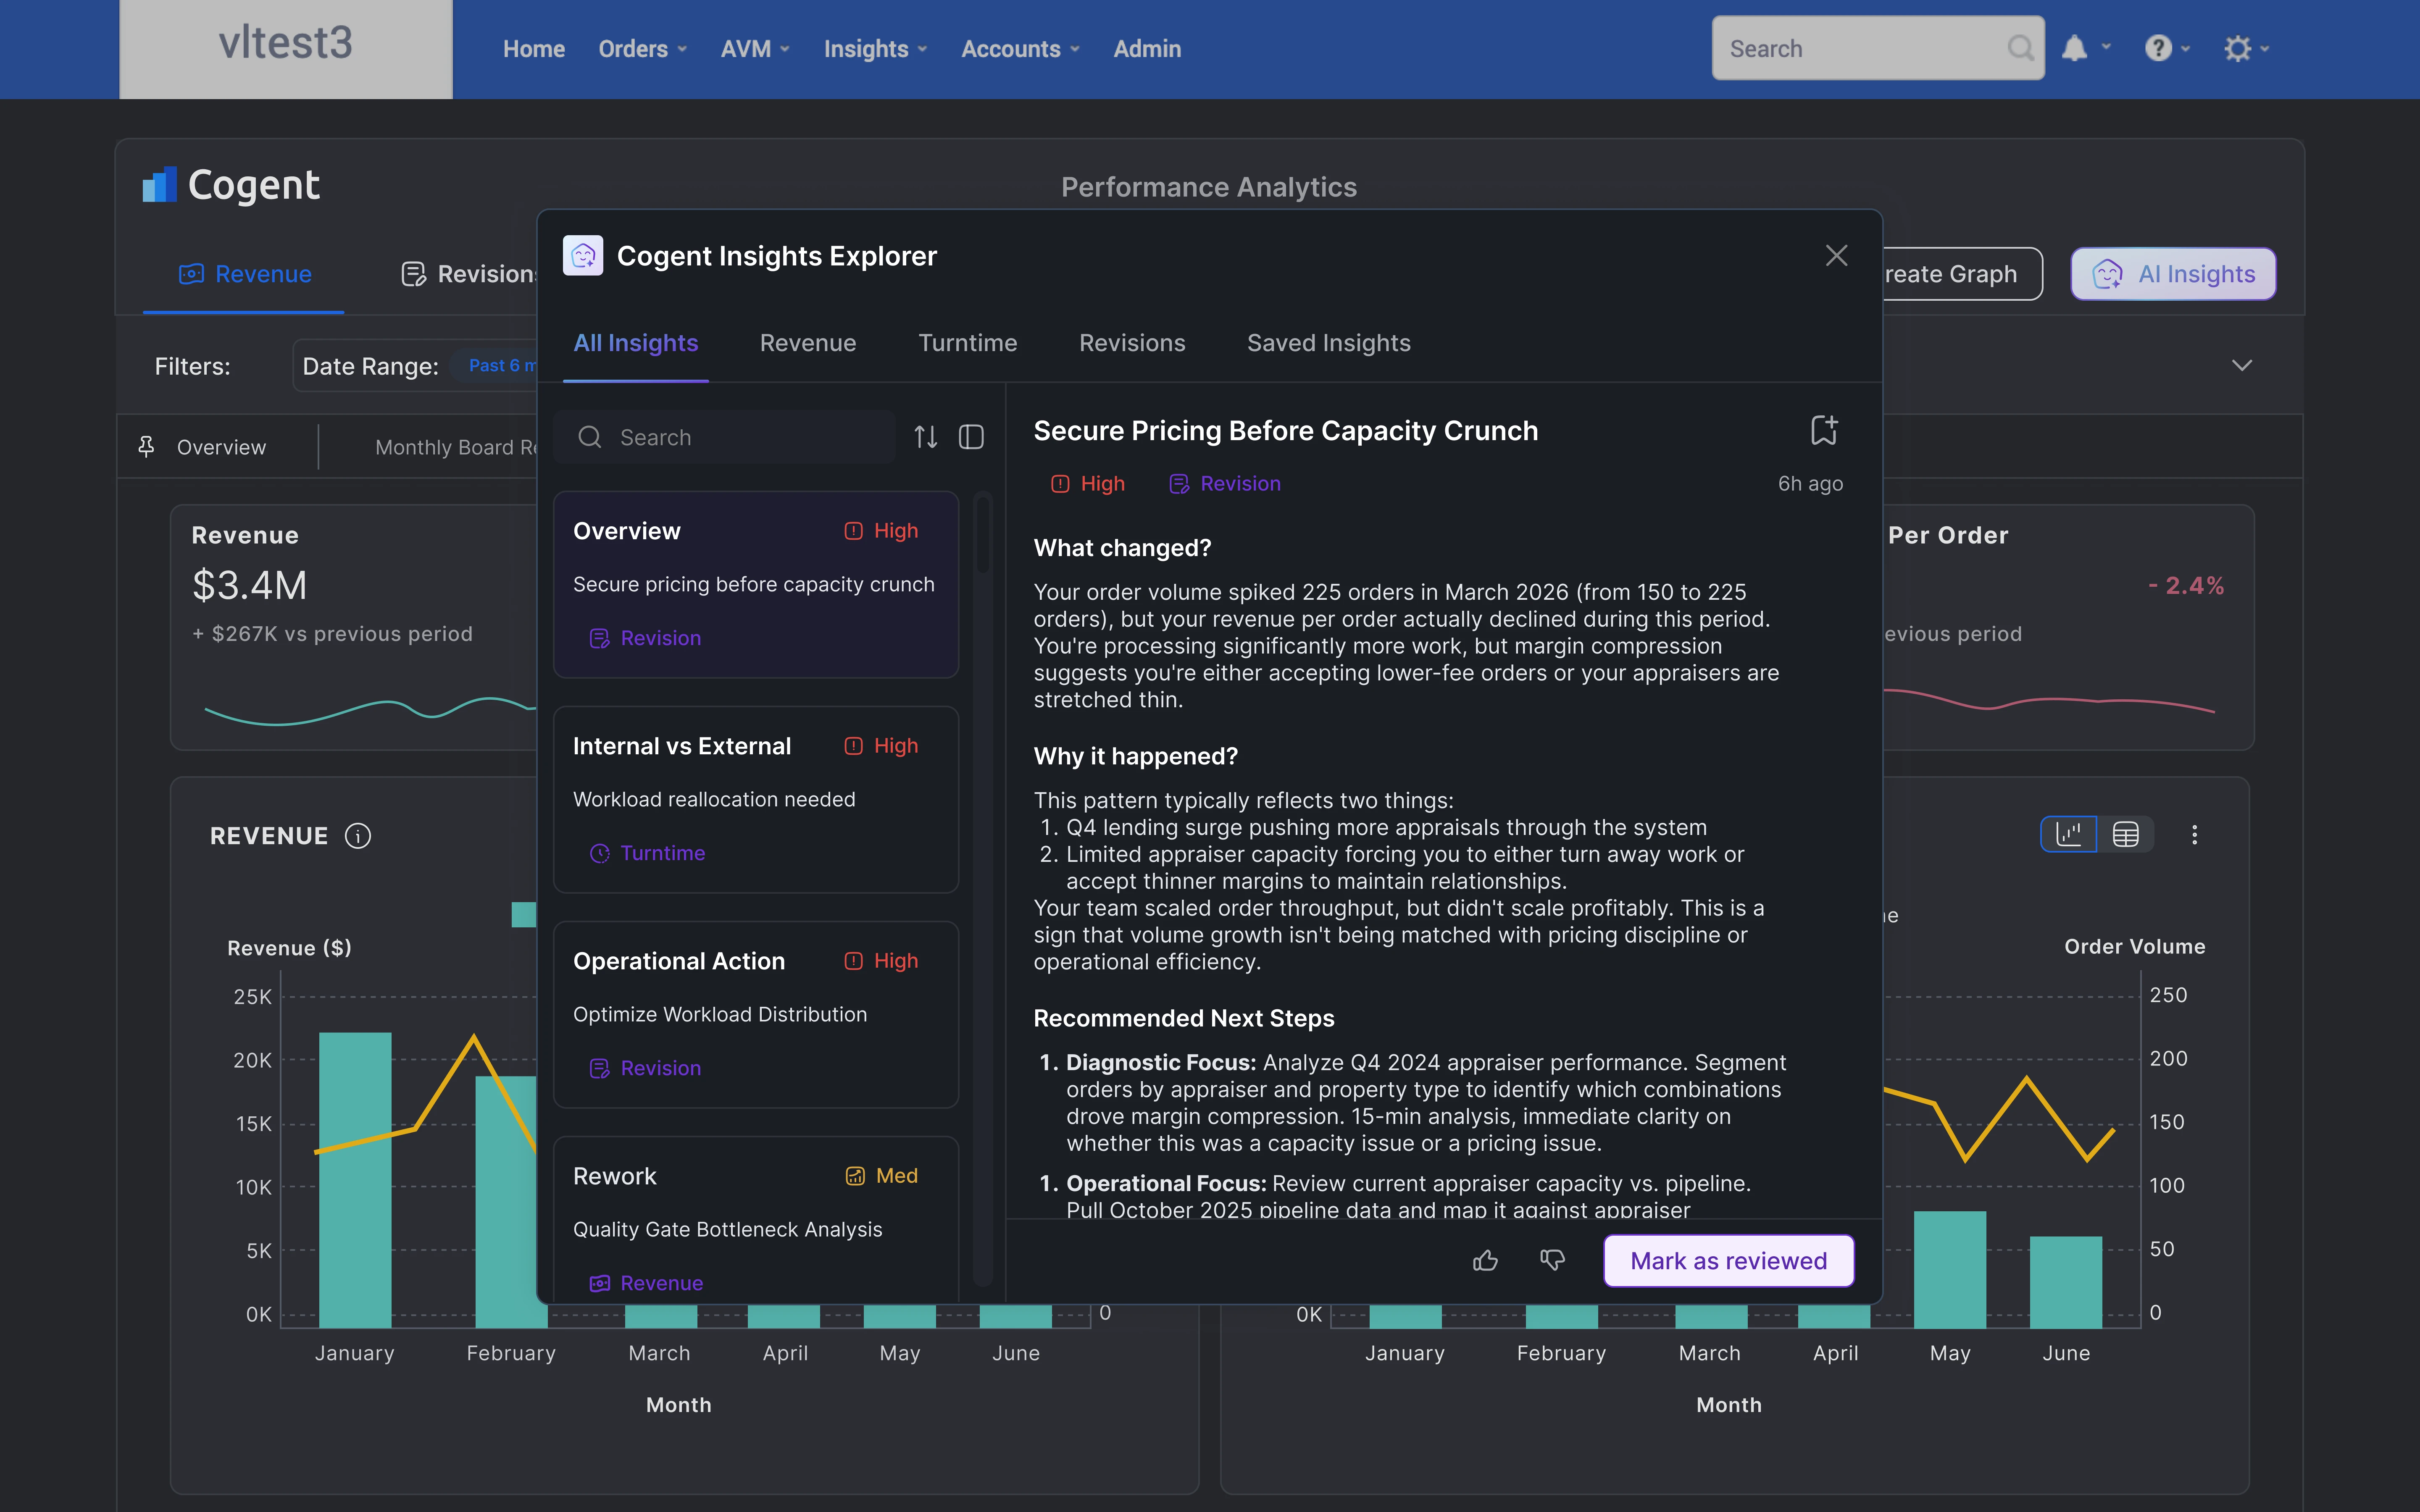
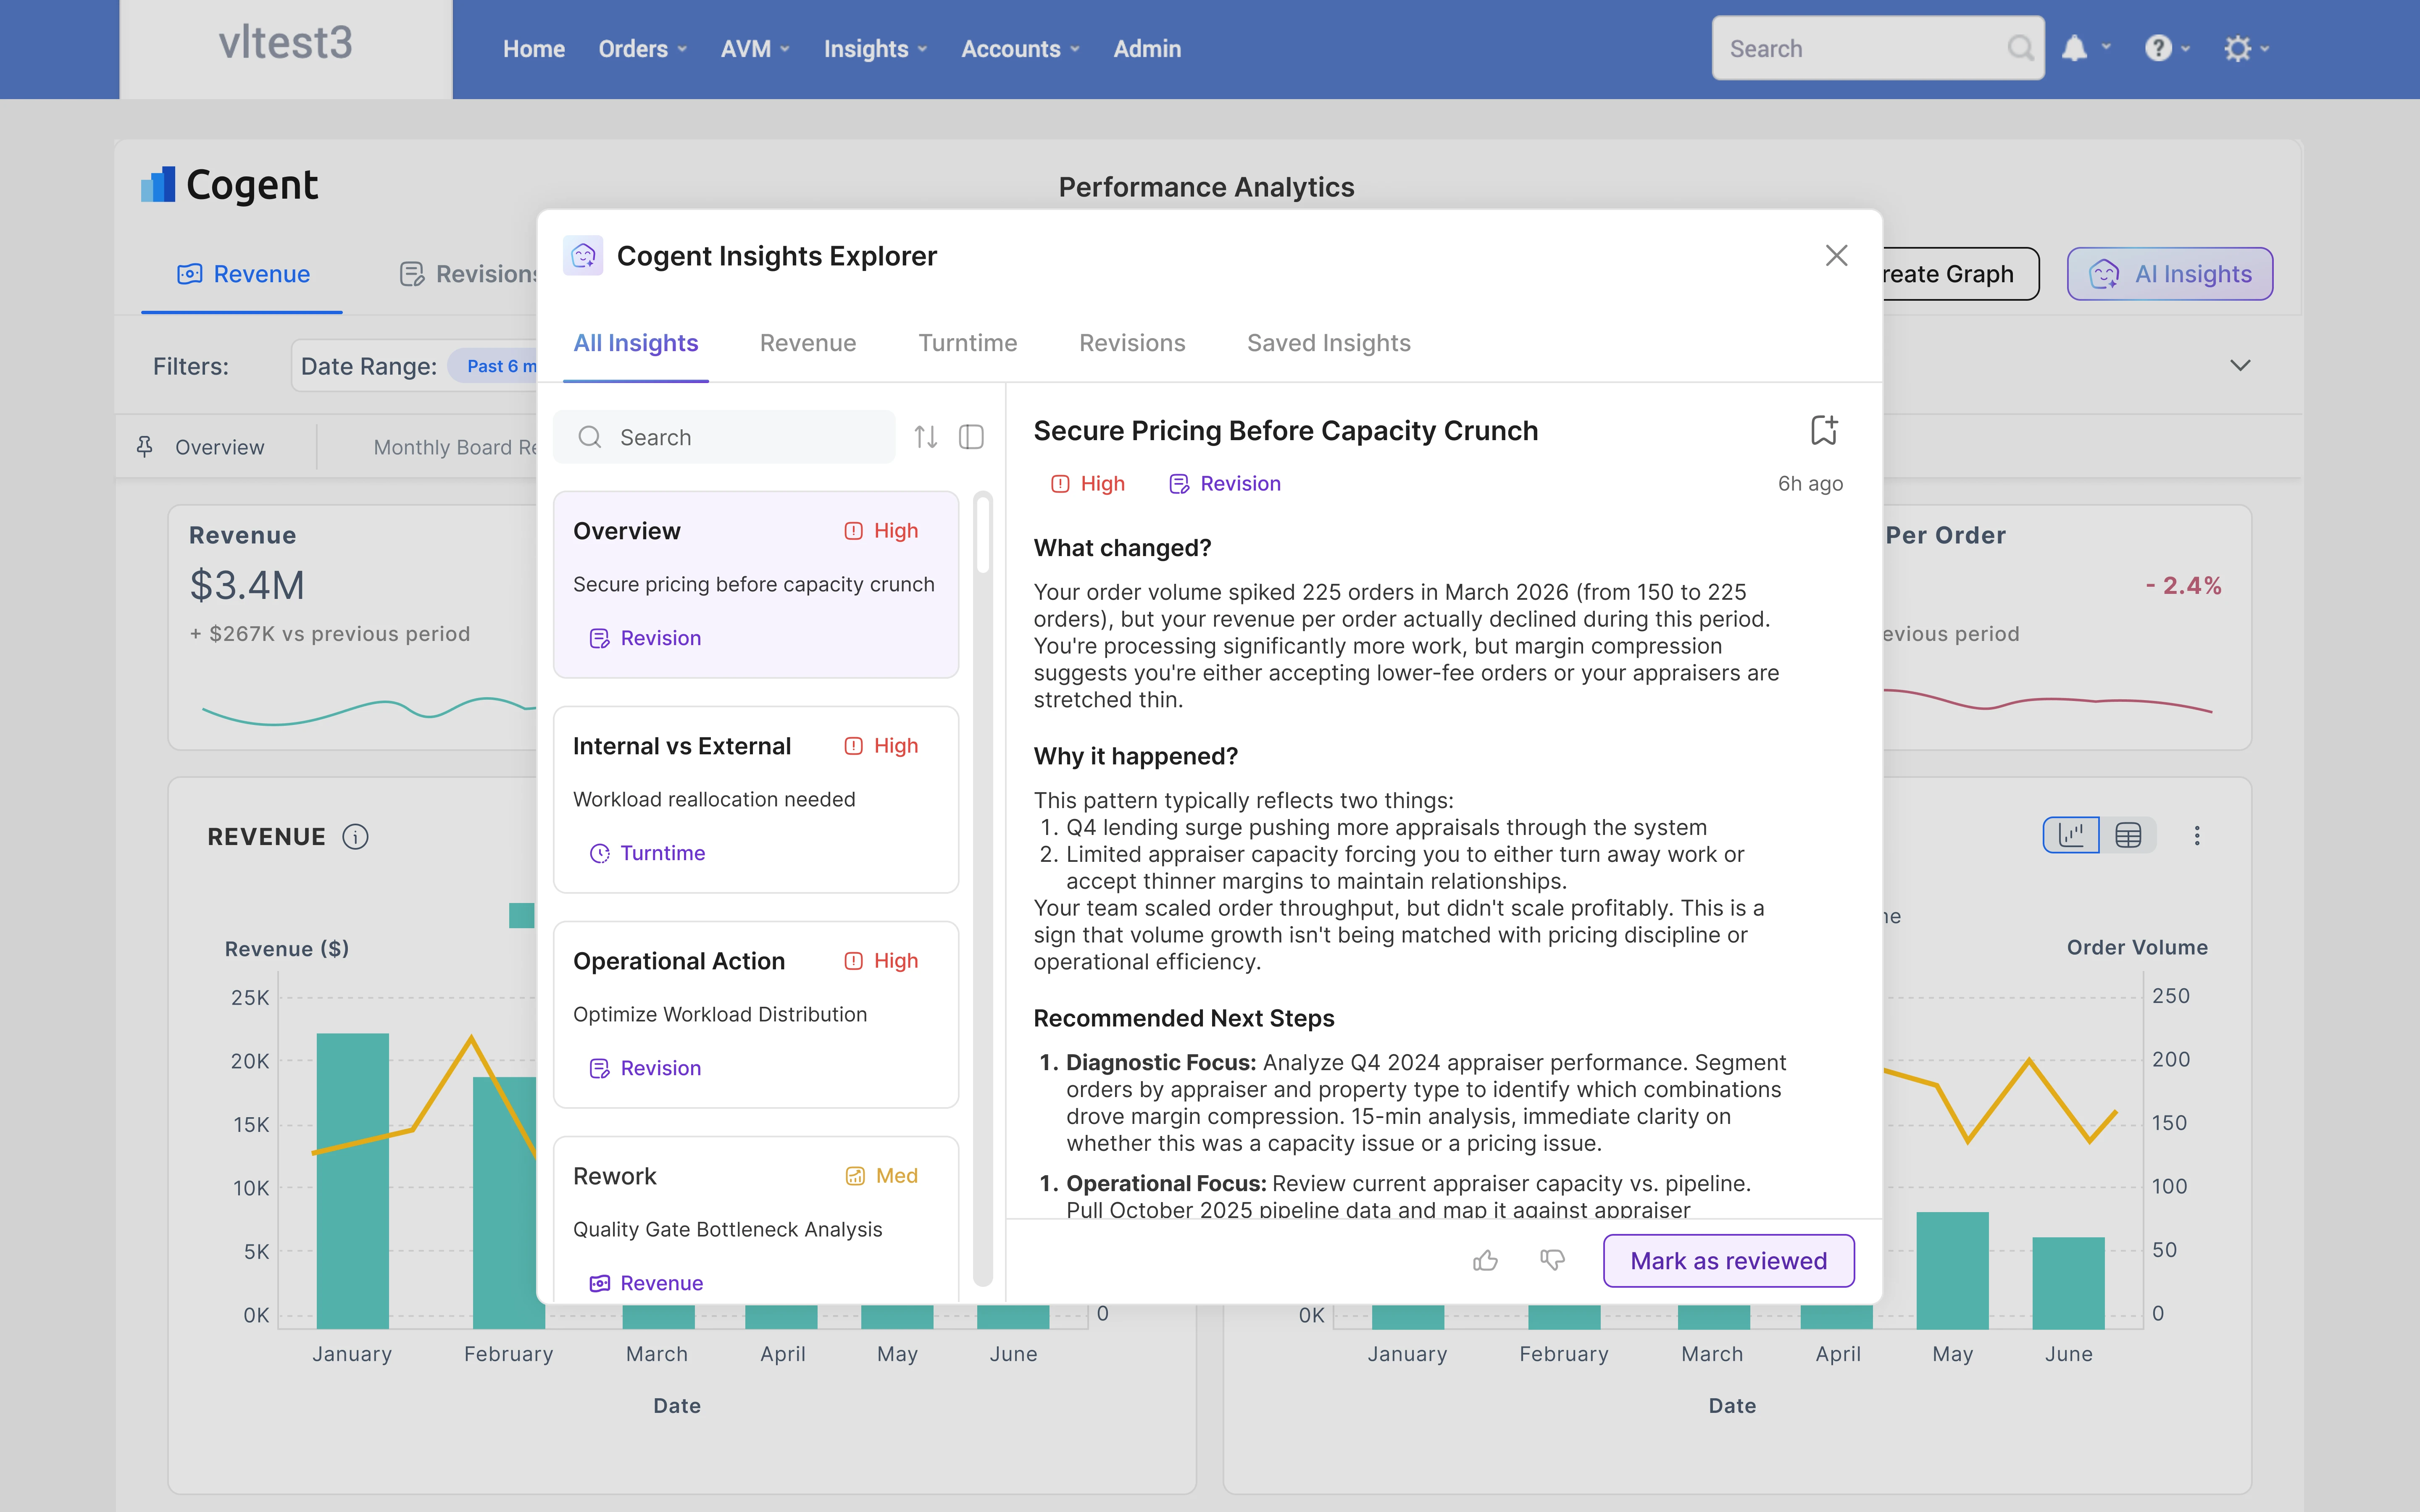
A structured, filterable system

Final design: Revenue dashboard

Revenue Dashboard

Final design: Cogent Insights Explorer

AI Insights

Terms & Conditions

Shipped, but no one could get in

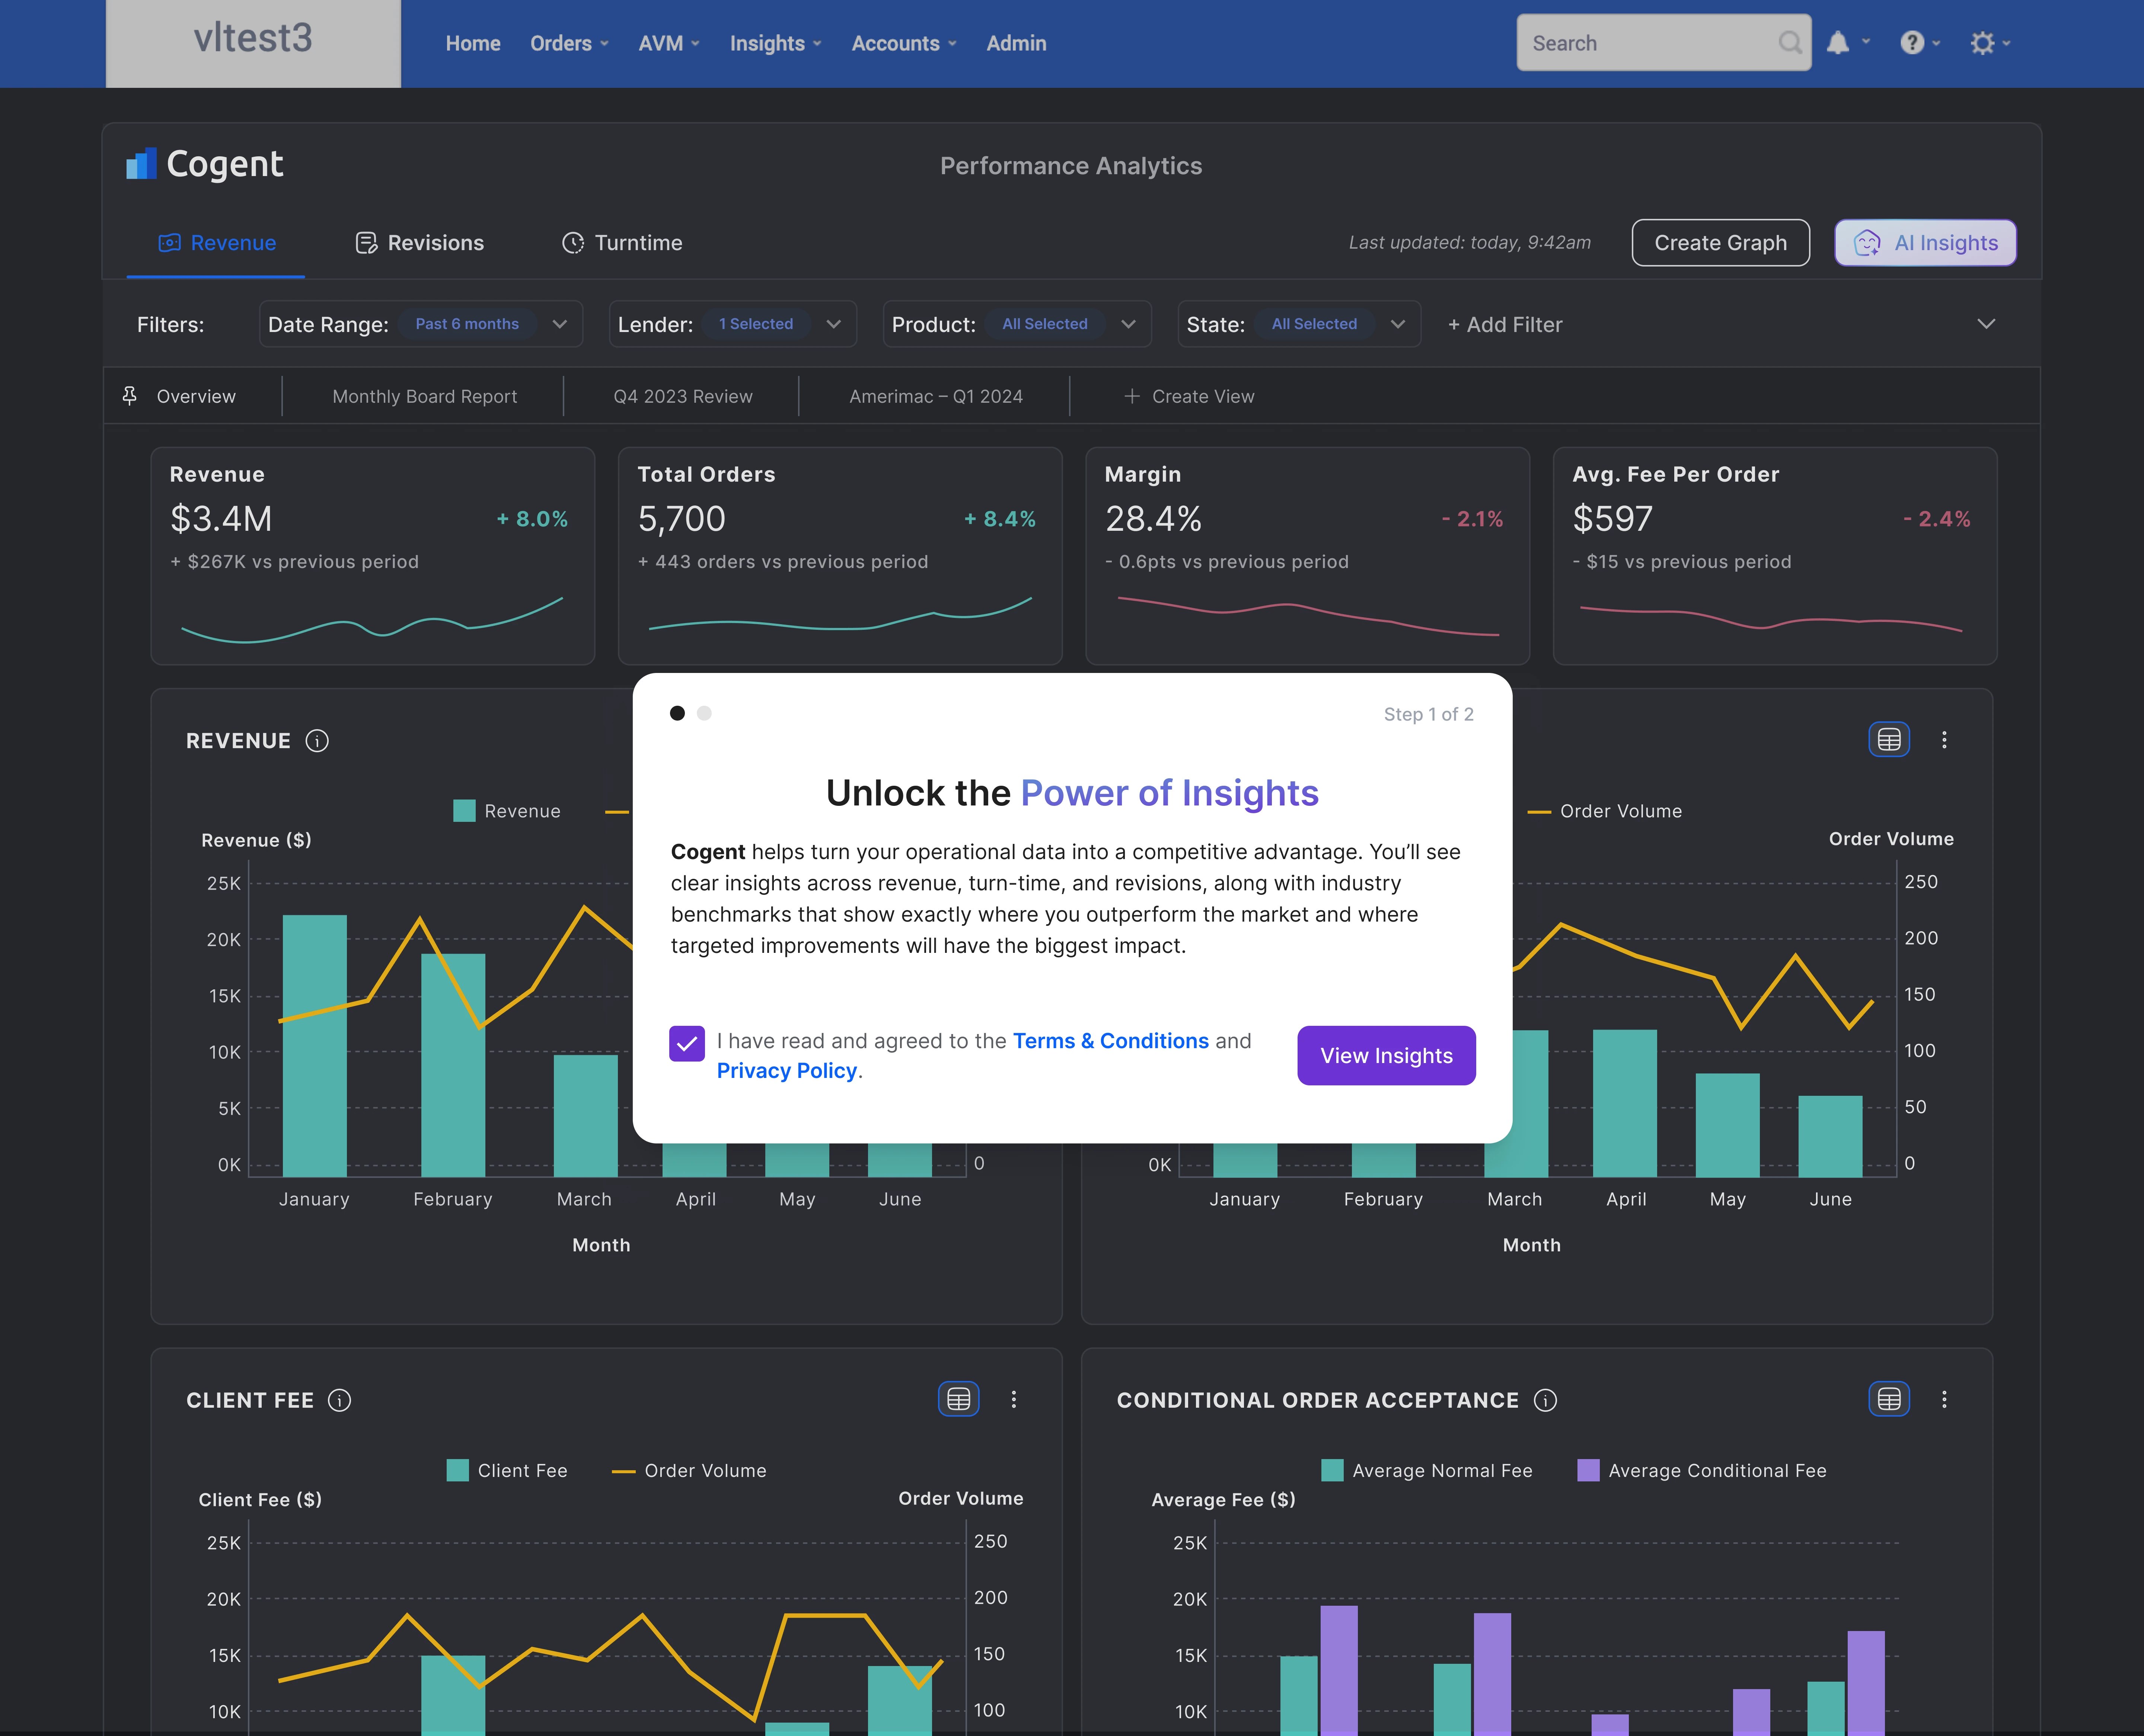
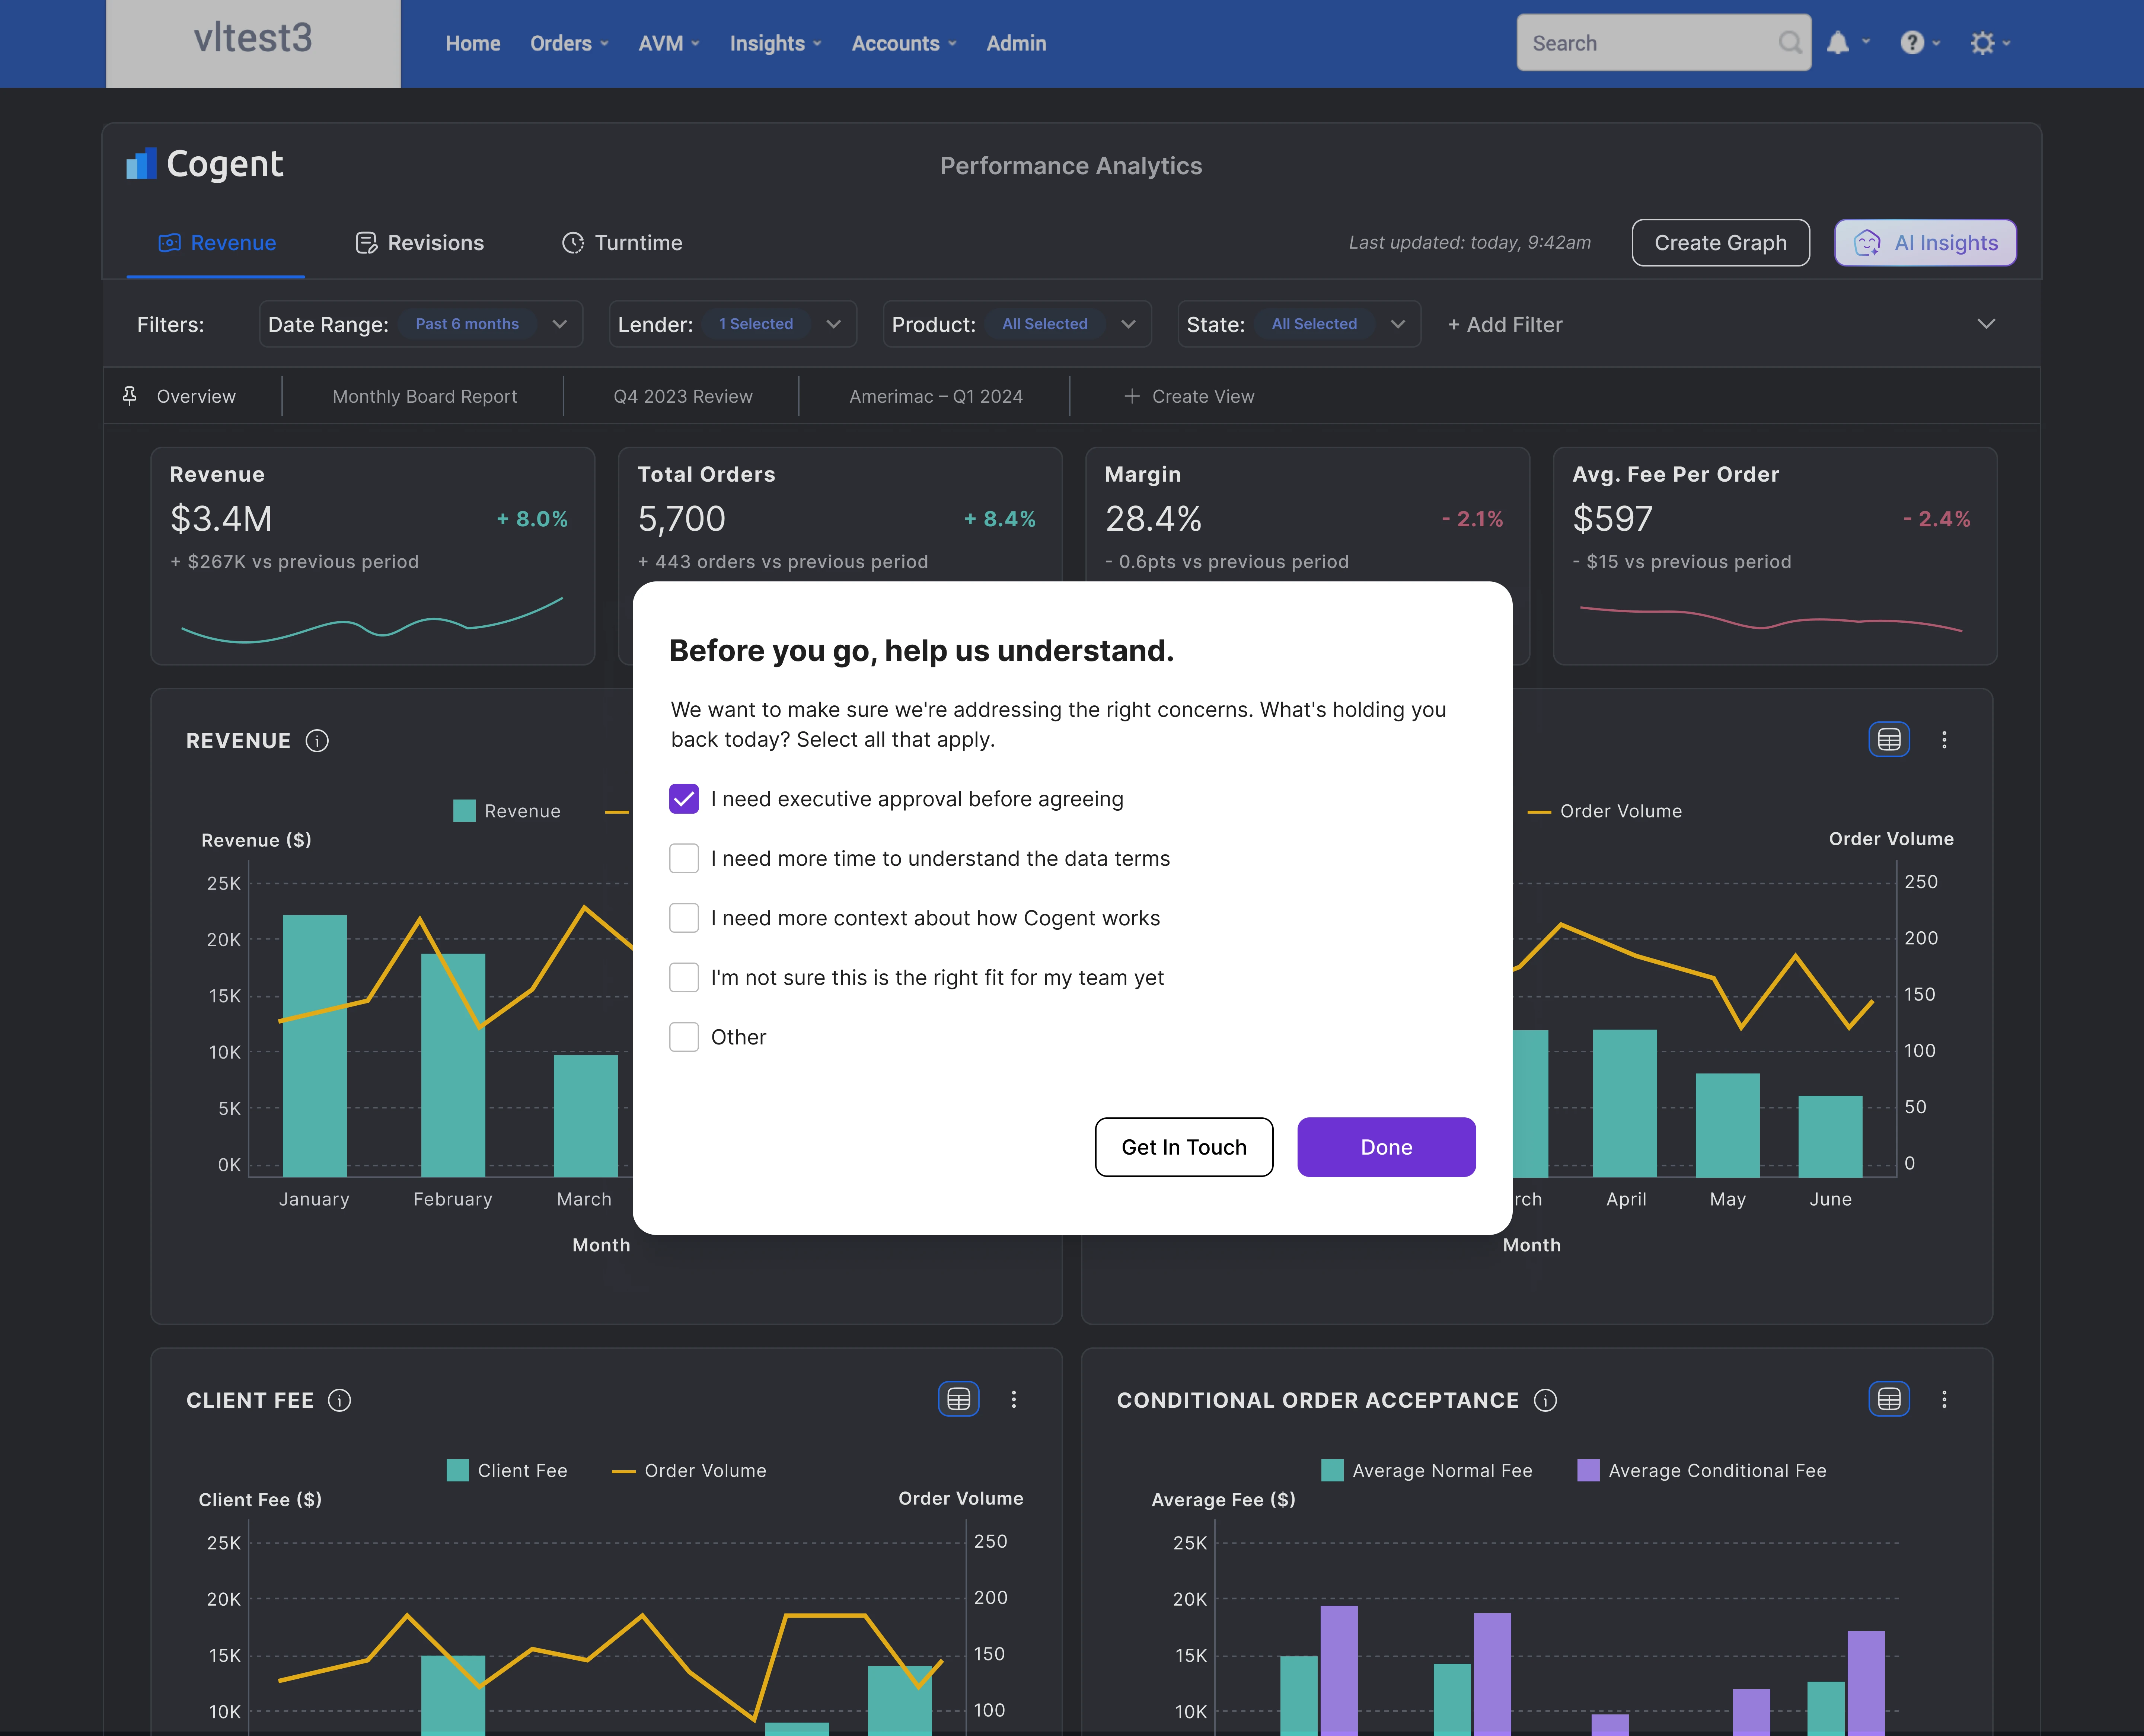
Cogent surfaces sensitive competitive data (fees, margins, operational metrics) across AMC and lender accounts. Explicit consent was legally required before access. Acceptance rates were low, and low acceptance meant no usage.

Terms and conditions consent modal

Terms & Conditions

I pushed back on gaming the acceptance rate

My PM's instinct was to inflate acceptance with a vague CTA and an obscured terms link. I pushed back: if we're going to suggest decisions to users, acceptance has to be genuine, not a UX trick to hit a number.

Terms & Conditions

Two theories, tested in parallel

Rather than betting on one theory and losing time if wrong, I built both paths at once, and let the decline reason tell me which theory was right.

If the user has authority

Decision-maker accepts Whole org unlocked

If they don't

User can't accept Decline reason captured as signal

Terms & Conditions

One authorized "yes" for the whole org

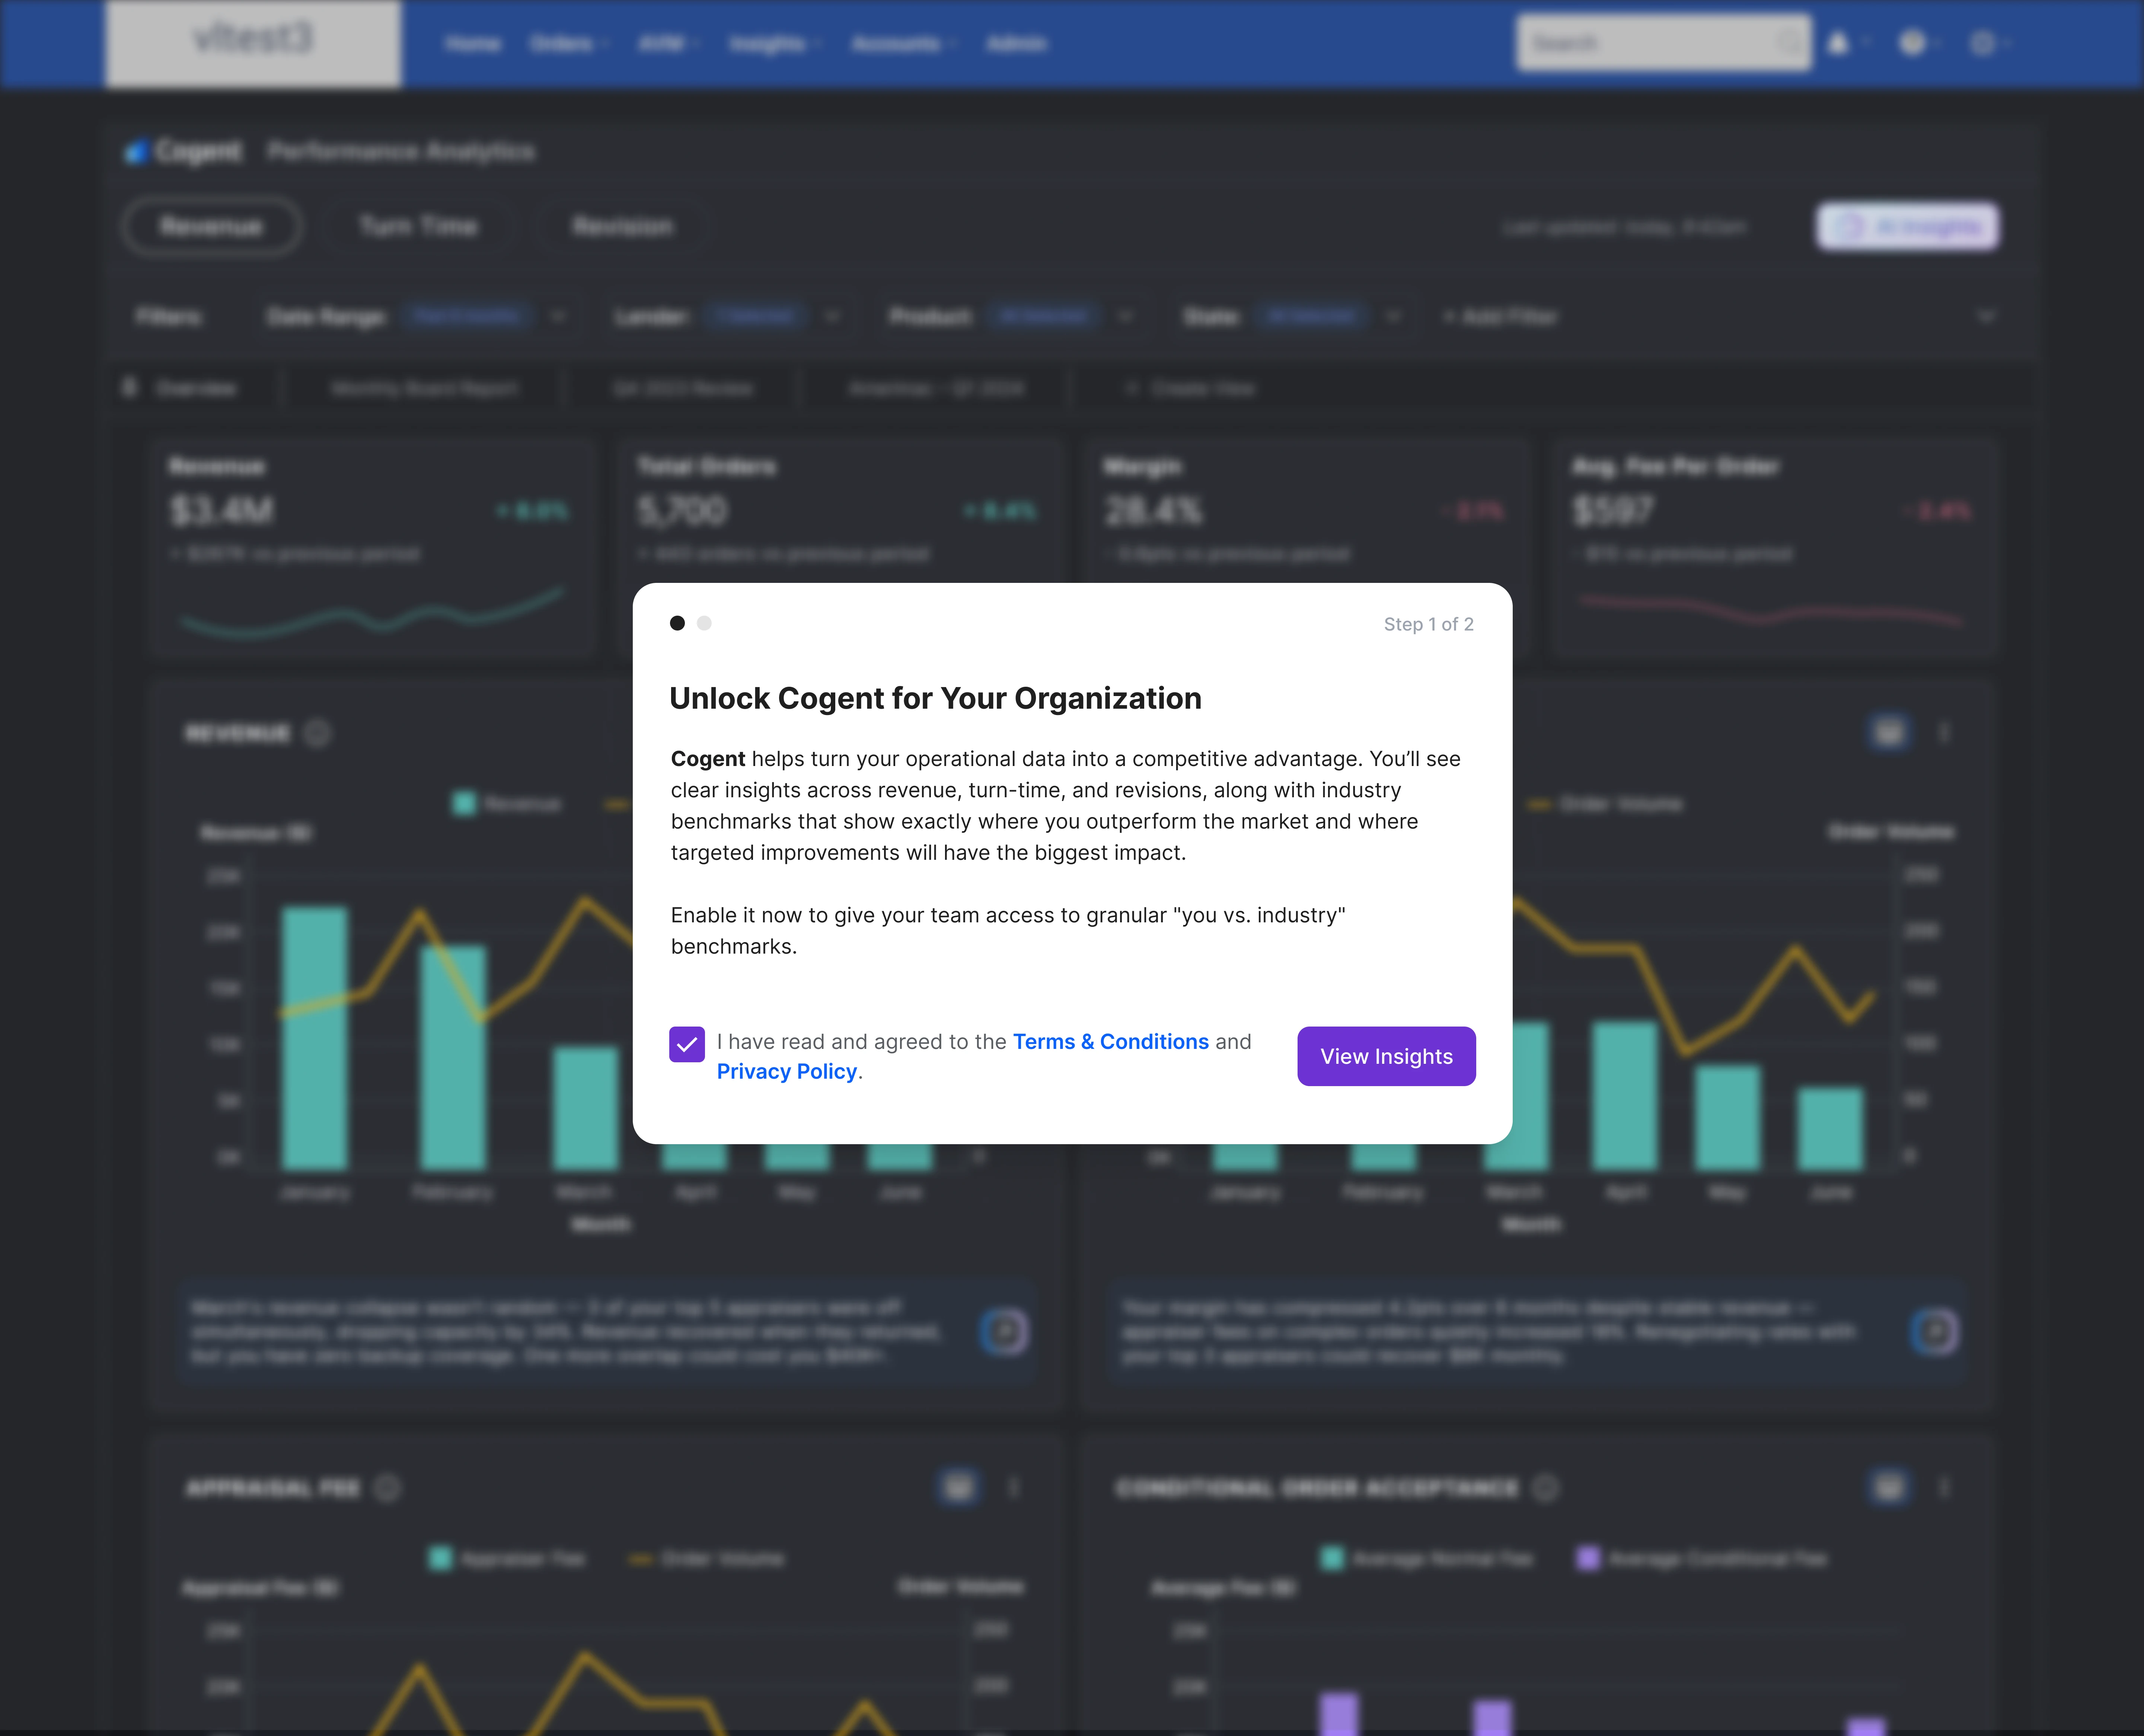
A targeted consent flow shown only to organizational decision-makers already active on Core. A single acceptance unlocked dashboard access for their entire team.

Terms and conditions modal shown to decision makers

T&C for Decision Makers

Terms & Conditions

Never stuck waiting on one inbox

If a decision-maker hadn't acted yet, individual users could still see the terms and accept directly if authorized, or decline with a reason, turning a dead end into a data point.

Terms and conditions modal shown to individual users

T&C for Other Users

Terms & Conditions

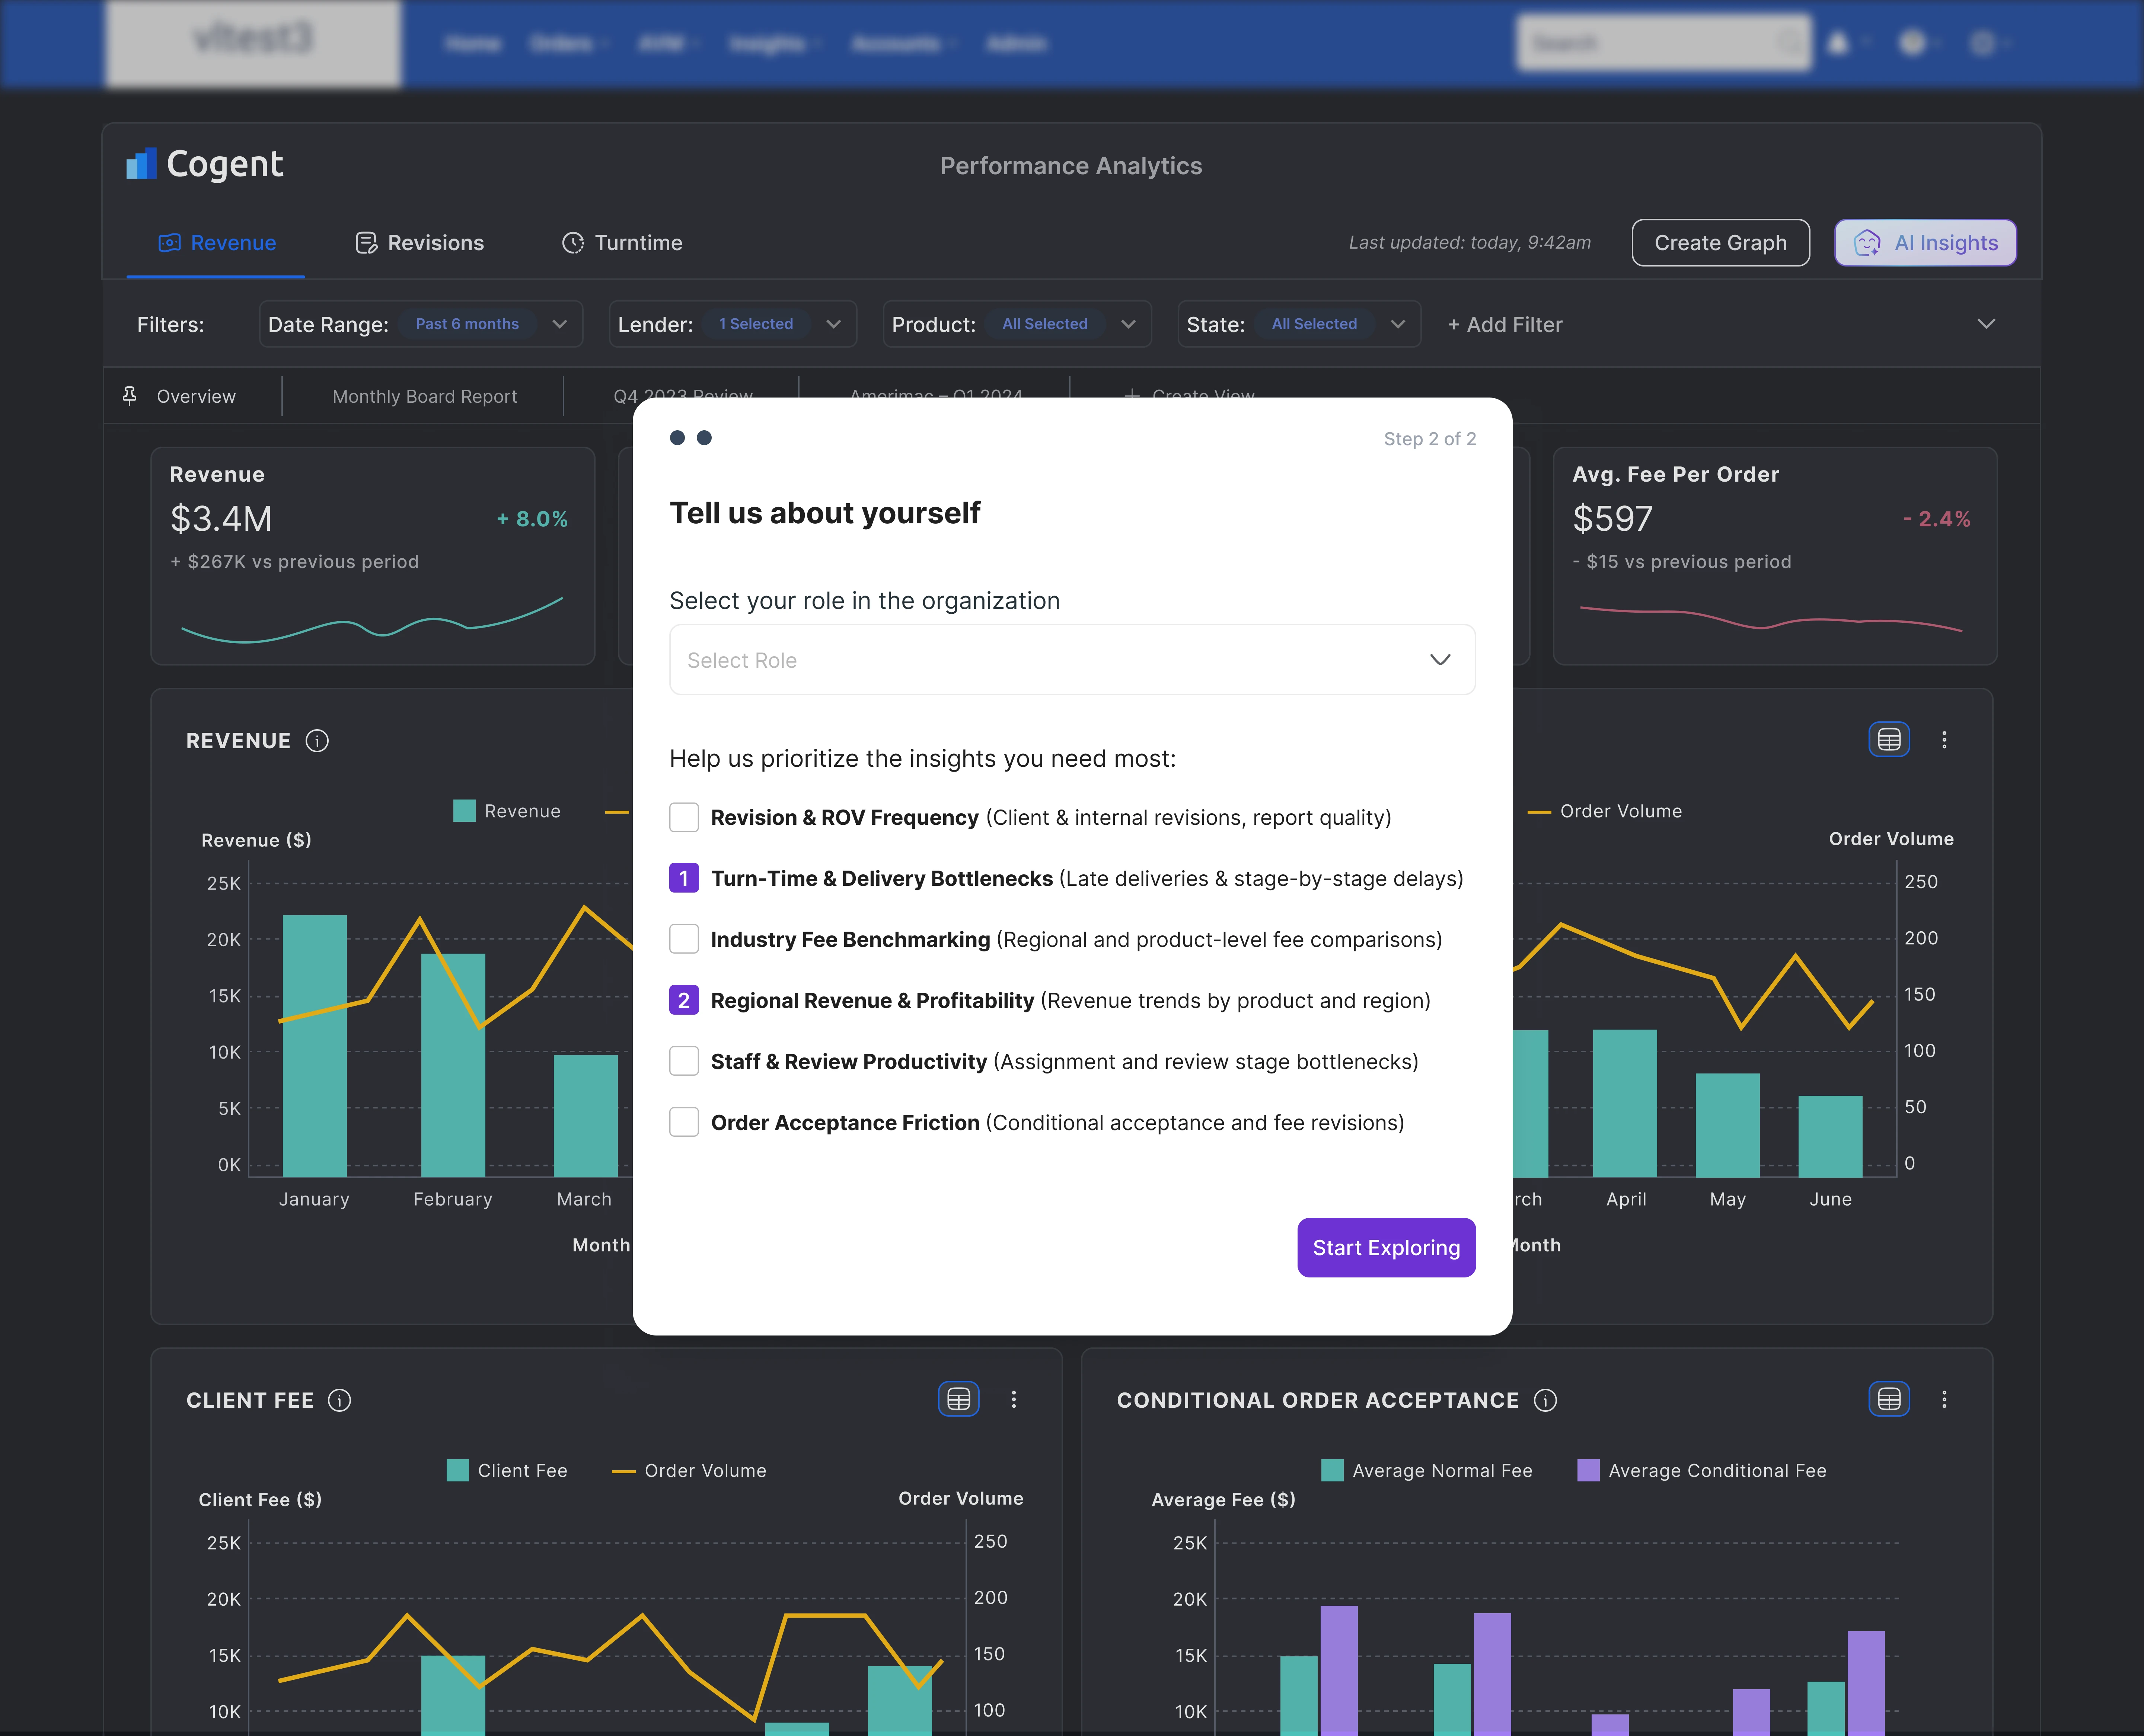
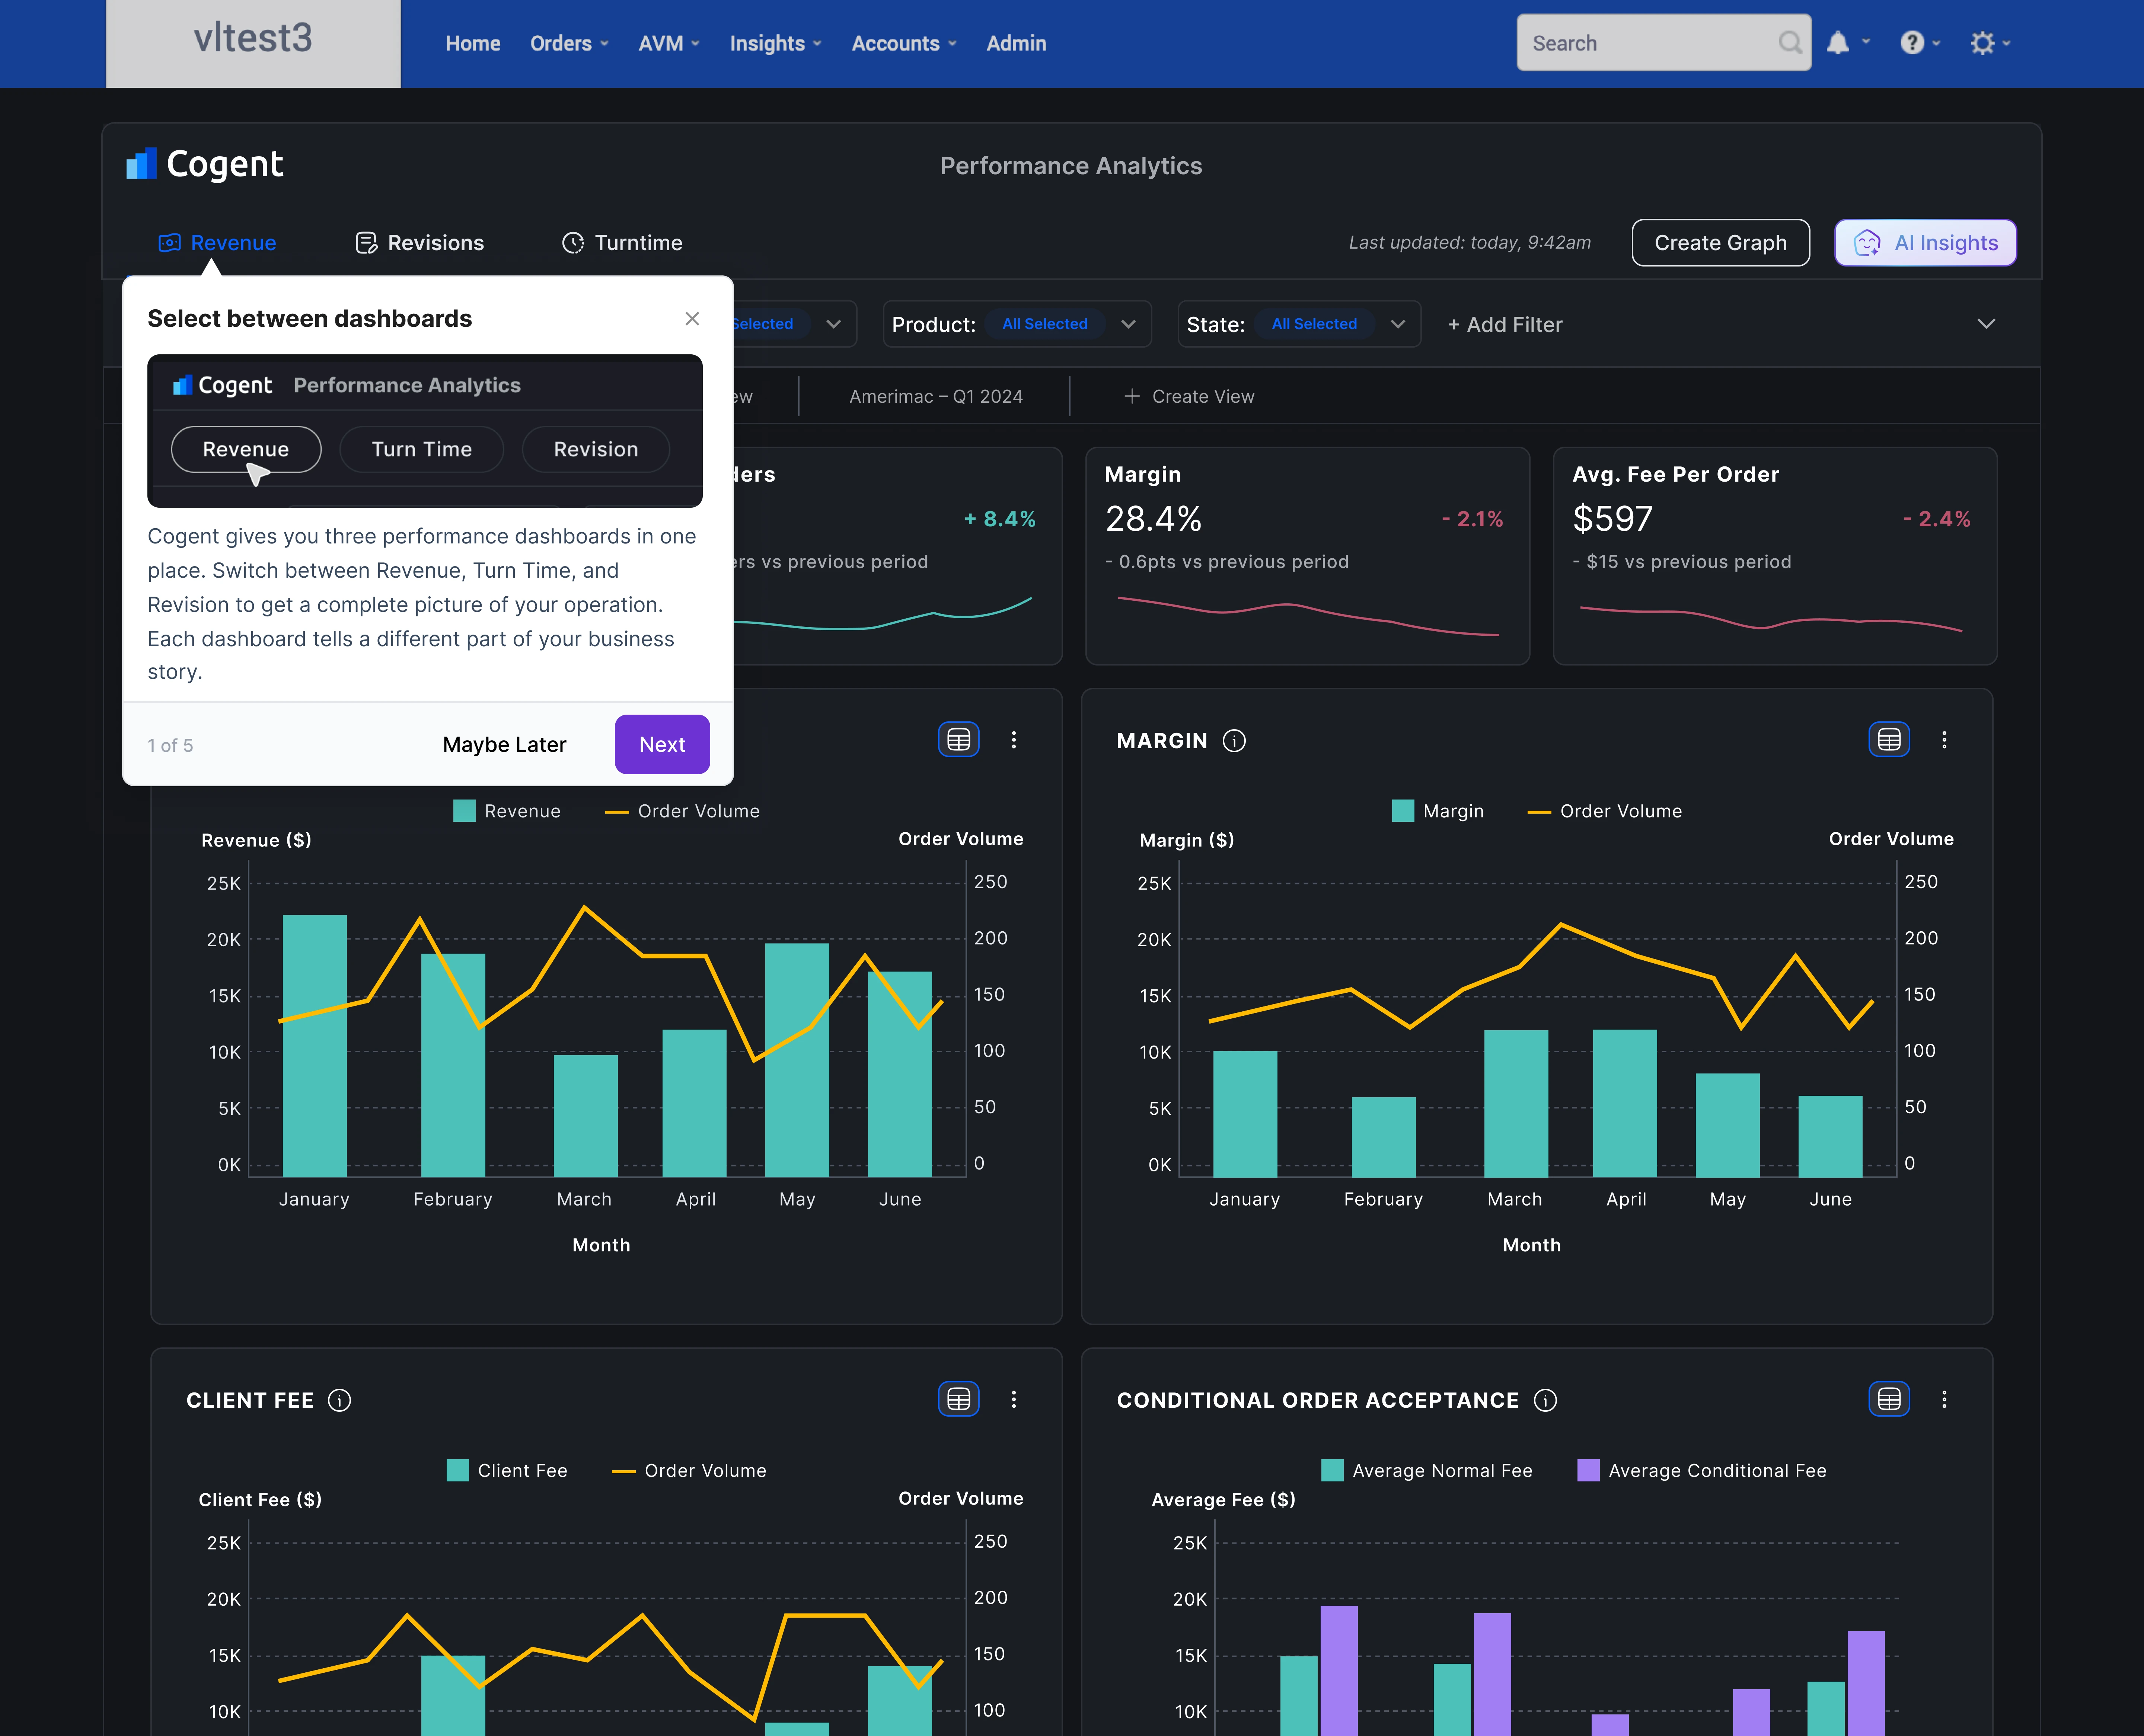
Acceptance journey

Role and uses step of the acceptance journey

Role and Uses

Guided tour step of the acceptance journey

Guided Tour

Terms & Conditions

Decline journey

Reason for declining step

Reason for Declining

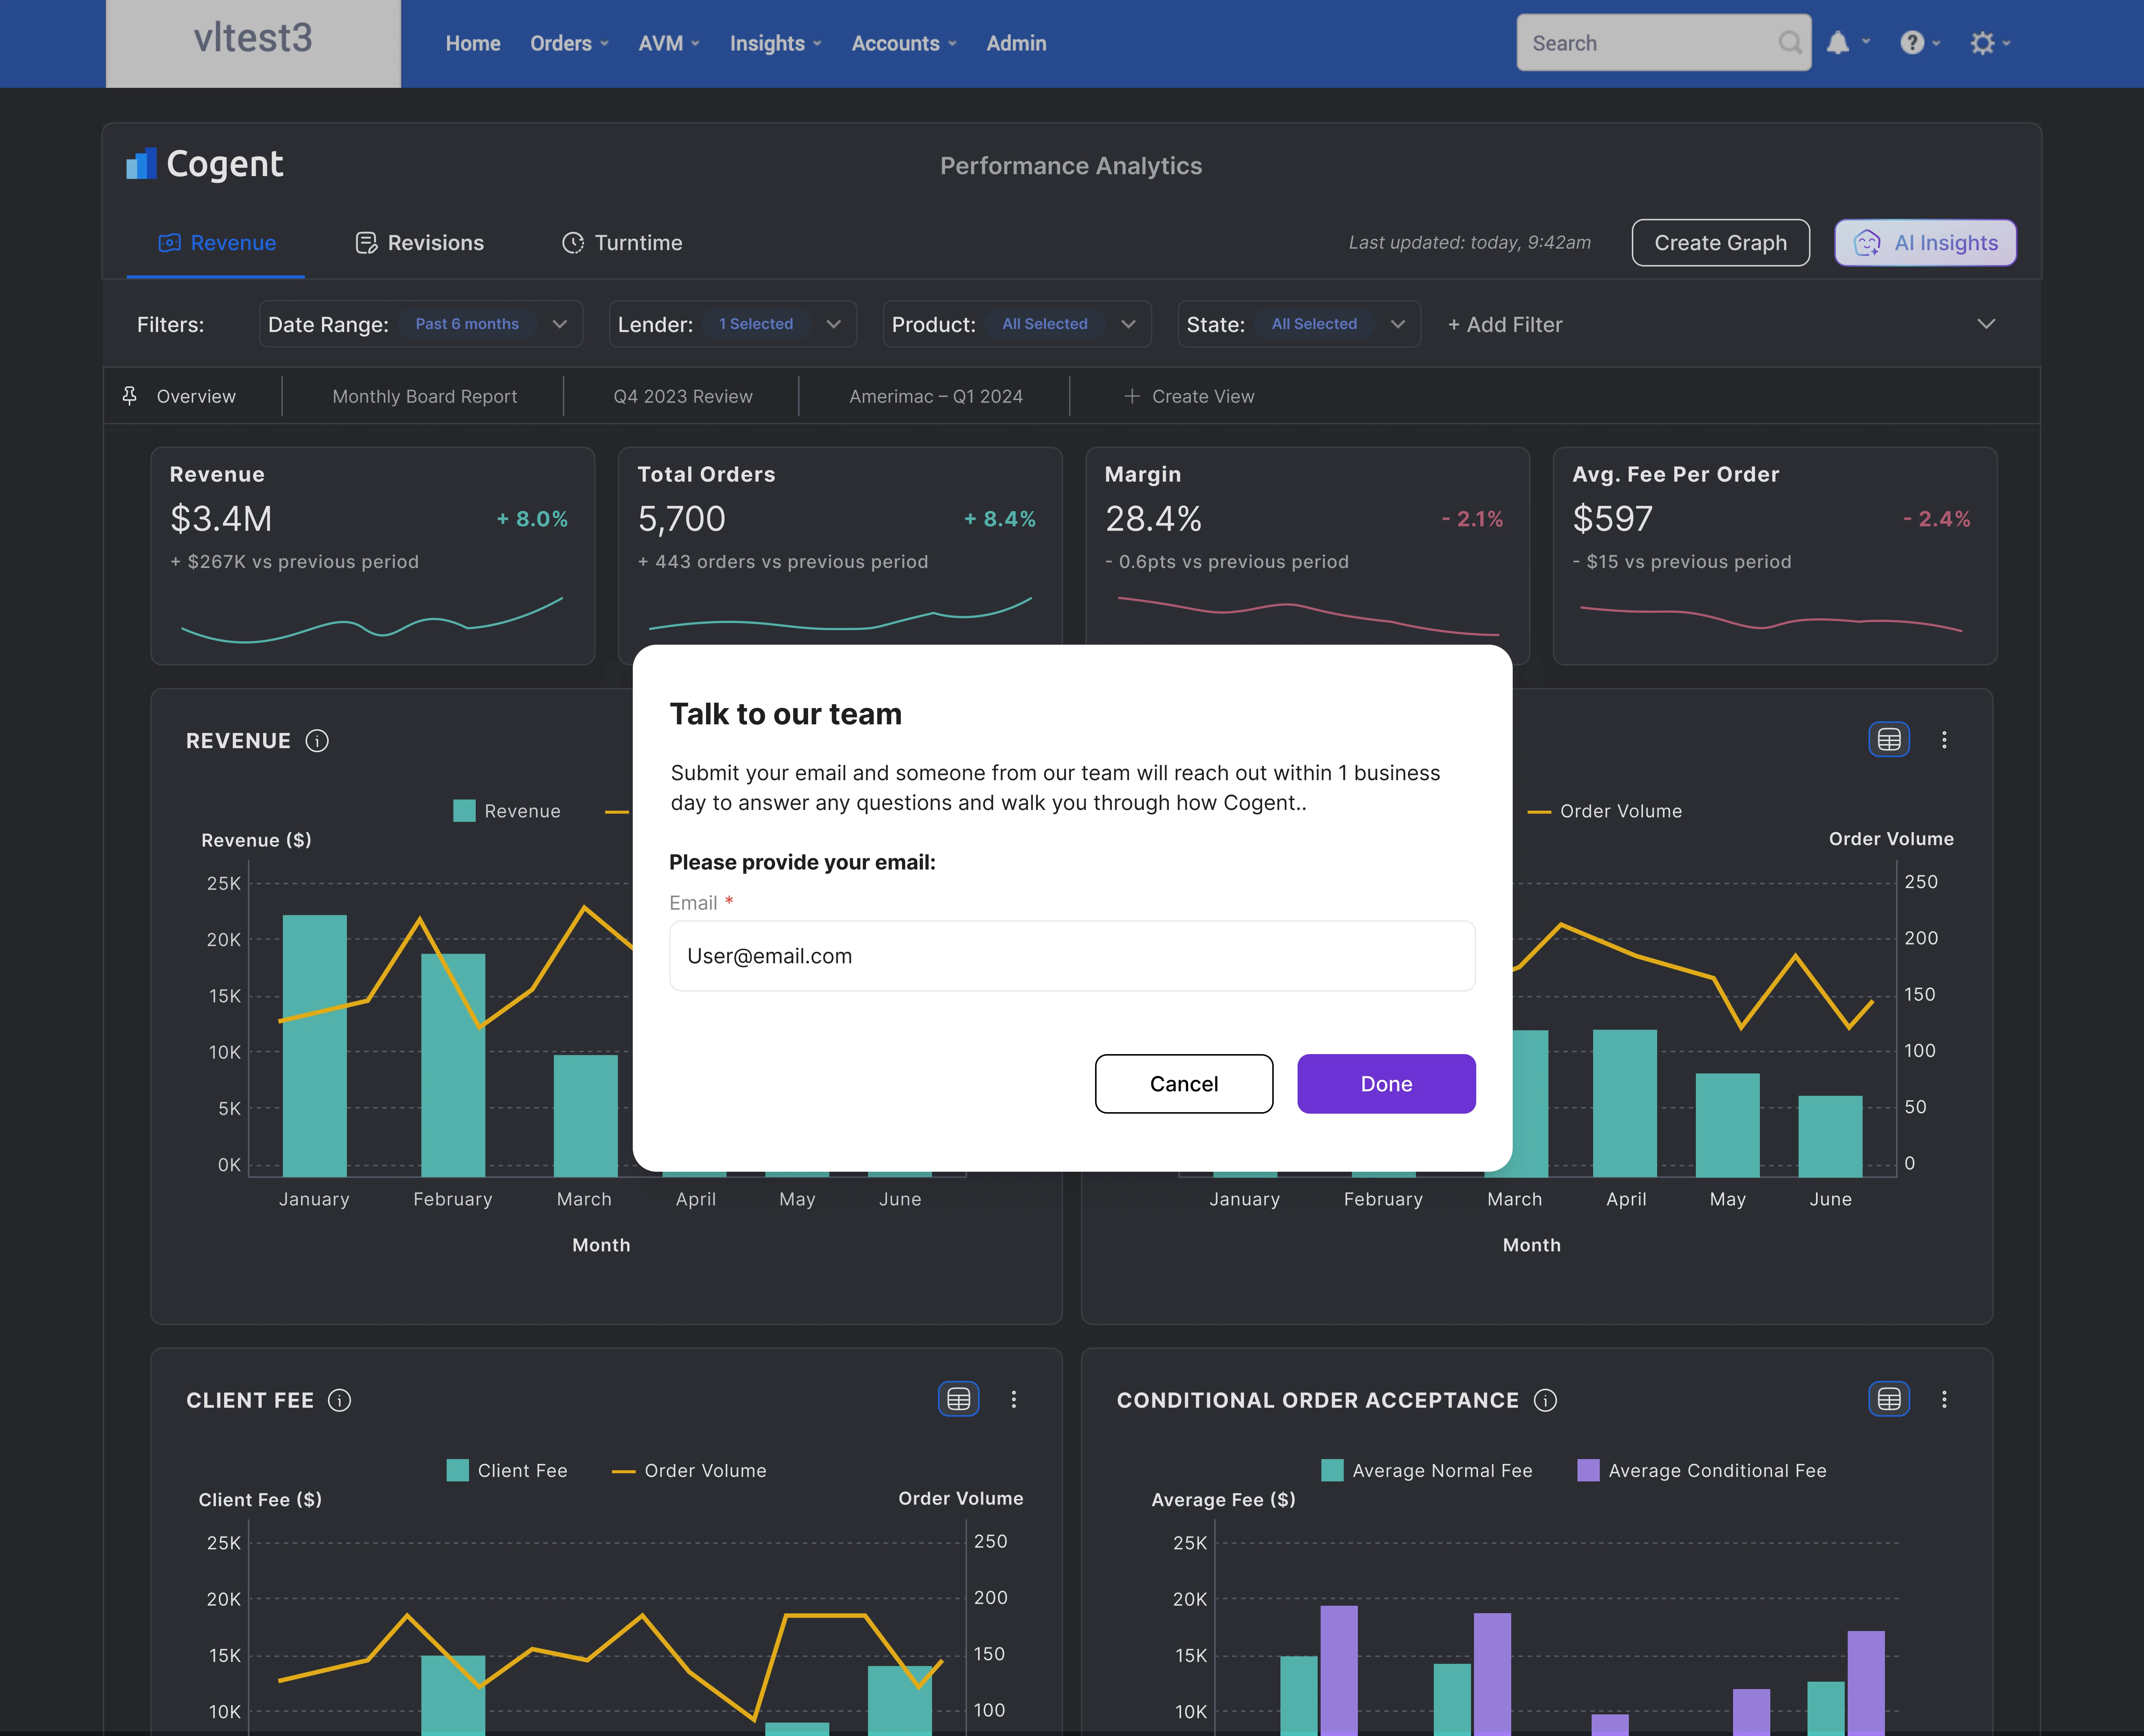
Get in touch step

Get In Touch

Testing and Feedback

The strongest signal wasn't a metric

Monitored with Clarity, Hotjar, and Mixpanel, plus direct client conversations. After shipping Revenue, clients started asking for the same clarity in Turn Time and Revision, before those dashboards even existed.

Results

How the numbers were measured

46.1%

Weekly active usage

Distinct AMC accounts that opened and interacted with the dashboard weekly, across 200+ lenders over 2 months: real engagement, not page loads.

30.2%

Increase in revenue

Subscription revenue tied specifically to Cogent Insights Explorer's paid tier, isolated from general platform growth.

200K+

Orders processed

Total order volume flowing through Cogent post-launch: real, high-volume operational activity, not a small pilot group.

Reflections

Why a modal, not a side panel

Reserved the side panel for a not-yet-built AI workflow agent (operational, in-flow). Cogent Insights is analytical and reflective, a moment to step back from the workflow. The modal reinforces that distinction, even though it costs temporarily obscuring the dashboard.

Reflections

What I'd carry into the next one

Legal tension is a design problem

"Friendly friction" and "hidden friction" aren't the same, even when they move the same short-term metric. Solve the real adoption problem instead of gaming the number meant to represent it.

Dashboards win on prioritization, not density

Every competitor leaned toward showing more. What moved usage and revenue was deciding which handful of insights were worth a user's attention.

Why This Matters

Design + engineering, at the same altitude

This project is the shape of how I work: a collaborative, cross-functional practice; technical and AI-first execution, from Figma through shipped front-end code; and a senior design voice that pushes back when it matters and builds when it counts.

That's the Full Arc

Happy to go deeper on any part of it: the research, specific design decisions, stakeholder moments, or the technical implementation. What would be most useful to dig into?